
Abstract
Objective
This study aimed to evaluate whether adding a broad set of pre-treatment [18F] fluorodeoxyglucose positron emission tomography/computed tomography (18F-FDG PET/CT) metabolic and volumetric parameters to routine clinical variables improves the prediction of overall survival (OS) in patients with gastric cancer (GC). Secondary objectives were to assess the prognostic value of blood- and spleen-normalized metabolic indices and to explore associations between PET metrics and HER2 status.
Methods
In this retrospective cohort, pre-treatment 18F-FDG PET/CT data were analyzed to extract standardized uptake value (SUV)- and volume-based PET metrics, BLR_mean, and SLR_mean. Clinical variables, pathological features, treatment details, HER2 status, and survival outcomes were obtained from institutional records. OS was calculated based on the date of initial management. Prognostic performance was evaluated using Cox models, calibration metrics, time-dependent area under the curve (AUC), and decision curve analysis (DCA). Nested models (clinical-only vs. clinical+PET) were compared to determine the incremental value.
Results
SUV- and volume-based PET metrics showed variable but directionally consistent associations with OS. Metabolic tumor volume (MTV_40) and total lesion glycolysis (TLG_40) demonstrated trends toward worse outcomes, although these effects did not consistently reach statistical significance in multivariable analyses. Blood- and spleen-normalized parameters (BLR_mean and SLR_mean) showed stronger effects in the PET-only model but became attenuated after adjustment for clinical covariates. Incorporating PET parameters into the clinical model modestly improved discrimination and yielded acceptable calibration. HER2-positive tumors exhibited higher metabolic activity; however, no significant interaction was observed between HER2 status and the prognostic effect of PET metrics. Across clinically relevant decision thresholds (10–40%), the combined Clinical+PET model achieved higher net benefit than the clinical model alone. The combined model demonstrated a higher net benefit at 12 and 24 months.
Conclusion
Pretreatment 18F-FDG PET/CT appears to provide additional prognostic information beyond routine clinical variables in GC. The inclusion of SUV-based, volumetric, and normalized metabolic parameters modestly improves risk stratification and is associated with favorable decision-analytic performance. These findings support integrating quantitative PET metrics into prognostic evaluation frameworks for patients undergoing management for GC.
Keywords: Gastric cancer, positron-emission tomography, fluorodeoxyglucose F18, prognosis, survival analysis
INTRODUCTION
GC is still one of the leading causes of cancer-related death worldwide, despite improvements in diagnosis and treatment (). The 2019 WHO classification emphasizes the biological diversity of gastric adenocarcinoma, distinguishing intestinal, diffuse, mixed, and other subtypes with distinct patterns of behavior and prognosis (). This variability diminishes the predictive utility of standard clinicopathological variables and underscores the necessity for quantitative markers that more precisely represent tumor biology. [18F] fluorodeoxyglucose positron emission tomography/computed tomography (18F-FDG PET/CT) is used in selected patients to identify distant metastases and refine treatment decisions. Several studies have shown that staging 18F-FDG PET/CT can reveal otherwise unsuspected metastatic disease and modify management in patients considered for radical therapy (, ). These findings suggest that PET-derived metabolic information may also offer predictions that go beyond conventional anatomical staging. 18F-FDG PET/CT quantifies tumor glucose uptake through metabolic indices such as standardized uptake value maximum (SUVmax) and SUVmean. A meta-analysis demonstrated that higher pre-treatment SUVmax is associated with worse OS, although study results vary with tumor subtype and methodology (). Cohort studies likewise report that SUV-based metrics correlate with more aggressive disease and poorer outcomes (). Volumetric PET parameters, including MTV and TLG, may better represent total metabolic burden than SUV alone. In resectable and locally advanced disease, higher MTV or TLG consistently predicted shorter OS or recurrence-free survival and in several reports outperformed SUVmax as prognostic indicators (-). Several reports indicate that MTV and TLG retain prognostic value even within biologically defined subgroups, for example, in c-MET–positive GCs, suggesting that these volumetric indices add information beyond conventional staging (). In parallel, there is increasing interest in intratumoral metabolic heterogeneity. Initial data suggest that non-uniform FDG uptake within the primary lesion, summarized by various heterogeneity indices, can predict survival independently of MTV and TLG (). Taken together, these observations raise the possibility that combining volumetric parameters with heterogeneity measures may better reflect underlying tumor biology. HER2 status is also an important modifier of GC behavior. Although available series are relatively small, several have reported higher FDG uptake and distinct metabolic patterns in HER2-positive tumors, with signals of an association with clinical outcome (, ). However, evidence remains limited and heterogeneous, and is rarely integrated into multivariable survival models. Overall, while metabolic and volumetric PET parameters show prognostic value in GC, it is not yet clear how much they improve established clinical risk models or whether integrating multiple PET-derived indices enhances prediction of OS in real-world settings (-). Few studies have examined calibration or clinical utility using decision-analytic methods.
In this study, we evaluated the incremental prognostic value of a broad panel of 18F-FDG PET/CT parameters—including SUVmax, SUVmean, SUV corrected for lean body mass peak (SULpeak), MTV_40, and TLG_40 as well as normalized measures such as BLR_mean and SLR_mean—when added to clinical prognostic models. We also assessed their relationship with HER2 expression and analyzed discrimination, calibration, and decision-analytic performance.
MATERIALS AND METHODS
Patient Selection
This retrospective observational study included consecutive patients with biopsy-confirmed primary gastric adenocarcinoma who underwent baseline 18F-FDG PET/CT for initial staging at Göztepe Prof. Dr. Süleyman Yalçın City Hospital between April 2016 and March 2025. Clinical, imaging, and follow-up data were obtained from institutional electronic records. No formal sample size calculation was performed; all eligible patients within the study period were included.
Eligibility criteria included age ≥18 years, histologically confirmed primary gastric adenocarcinoma, and availability of a pretreatment 18F-FDG PET/CT acquired before the initiation of oncologic therapy. Patients with missing imaging data, unavailable pathology reports, or insufficient follow-up information were excluded. In total, 92 patients were initially screened. Three patients were excluded: one with missing pre-treatment PET/CT, one with non-adenocarcinoma histology, and one with incomplete baseline clinical data. The final study cohort consisted of 89 patients.
The study was approved by the Noninterventional Clinical Research Ethics Committee of Göztepe Prof. Dr. Süleyman Yalçın City Hospital (approval number: 2025/0053; date: 31.07.2025) and was conducted in accordance with the Declaration of Helsinki. Owing to the retrospective design of the study, informed consent was waived.
PET/CT Imaging Protocol
All PET/CT examinations were performed on the same integrated device using a standard institutional protocol. Patients fasted for at least 6 hours, and a weight-based dose of 18F-FDG (3.7 MBq/kg) was administered intravenously. Image acquisition started 60–70 minutes after injection.
Low-dose CT (140 kV, 40–60 mAs, 5-mm slices) was used for attenuation correction and anatomical localization. PET data were acquired from the skull base to mid-thigh and reconstructed in axial, coronal, and sagittal planes using consistent parameters throughout the study period.
Quantitative PET Metrics
Tumor segmentation was performed on the primary gastric lesion using semiautomated three-dimensional volumes of interest, and all VOIs were jointly reviewed and finalized by two nuclear medicine physicians with more than 12 years of PET/CT experience. To reduce potential bias, all quantitative PET metrics were extracted using a standardized protocol. The retrospective, single-center nature of the study, heterogeneity in treatment pathways, and missing HER2 data represent the main potential sources of bias. We sought to limit selection bias by including all eligible consecutive patients and to minimize measurement bias by using consistent PET/CT acquisition and reconstruction protocols throughout the study period. Survival bias was reduced by defining overall survival (OS) as beginning at the start of cancer management.
The following quantitative parameters were recorded:
SUVmax, SUVmean, SUVpeak, SULmax_James, SULpeak_James, SULmean_James, metabolic tumor volume at 40% of SUVmax (MTV_40) and total lesion glycolysis (TLG_40), BLR_mean = tumor SUVmean / bone marrow SUVmean, and SLR_mean = tumor SUVmean / spleen SUVmean. Tumor size on CT was measured as the largest axial diameter.
Lean body mass was estimated using the James equation.
For men: LBM = 1.10 × weight (kg) − 128 × [weight (kg)/height (m)]².
For women: LBM = 1.07 × weight (kg)− 148 × [weight (kg)/height (m)]².
SUL values were calculated by normalizing SUV to estimated lean body mass.
For bone marrow assessment, three-dimensional volumes of interest were placed within the T11–L4 vertebral bodies on PET/CT. A 75% SUVmax isocontour was used to delineate intramedullary uptake while excluding cortical bone and focal benign or metastatic lesions. After verification in the axial, coronal, and sagittal planes, the SUVmean values from the selected vertebrae were averaged and recorded as the bone marrow SUVmean.
Survival Endpoints
The primary endpoint was OS. OS was defined as the time (in months) from diagnosis or treatment initiation (OS_start in the dataset) to death from any cause or last known follow-up.
There was no loss to follow-up; censoring occurred only due to administrative end-of-study cutoffs.
Statistical Analysis
1. Descriptive Statistics
Continuous variables were described using the mean and standard deviation (SD), the median and interquartile range (IQR), and the observed minimum–maximum values. Categorical variables were summarized as counts and percentages.
2. Univariate Cox Regression
As an initial screening step, each PET/CT-derived quantitative metric (SUV/SUL measures, MTV_40, TLG_40, BLR_mean, SLR_mean, and tumor size) was entered separately into a Cox proportional hazards model. For these analyses, we estimated hazard ratios (HRs) with 95% confidence intervals (CIs) and reported the corresponding p-values.
3. Multivariable Cox Modeling
The main analysis consisted of three predefined Cox models:
a) Clinical Model
Included covariates were age, sex, and tumor differentiation (coded as 1 = well, 2 = moderate, 3 = poor/low). Lymph node metastasis was recorded as present or absent. Distant metastasis was defined as peritoneal carcinomatosis or the presence of at least one metastatic lesion in the bone, liver, lung, adrenal glands, or brain.
b) PET-Only Model
The included PET variables were SULmax_James, SULpeak_James, SULmean_James, MTV_40, TLG_40, BLR_mean, SLR_mean, and tumor size.
c) Clinical+PET Combined Model
The model was constructed by adding all PET variables to the clinical model. For each model, HR, 95% CI, p-values, and the concordance index (c-index) were obtained.
Potential confounding was addressed by prespecified multivariable Cox models including all clinically relevant covariates. Missing HER2 values (n = 19) were handled by listwise deletion for analyses involving HER2; no imputation was performed.
Model Handling and Software
HER2 status was missing for 19 patients; all other clinical and PET/CT variables had complete data.
There was no loss to follow-up; censoring occurred only due to administrative end-of-study cut-offs.
Differentiation was encoded ordinally, and sex was binarized (M = 0; W = 1).
All analyses were performed in Python 3.10 using the lifelines package (v0.30) and the CoxPHFitter function.
Survival Modelling and Model Performance
Cox proportional hazards models were fitted for three predefined predictor sets: (i) clinical variables (age, gender, tumor differentiation, lymph node metastasis, distant metastasis); (ii) PET-only variables (SULmax, SULpeak, SULmean, MTV_40, TLG_40, BLR_mean, SLR_mean, tumor size); and (iii) a combined Clinical+PET set including all of these covariates. Individual risk scores were derived from the model’s linear predictor. For each model, patients were dichotomized into low- and high-risk groups using the cohort median, and OS was compared with Kaplan–Meier curves and two-sided log-rank tests (). Model discrimination was summarized using the c-index.
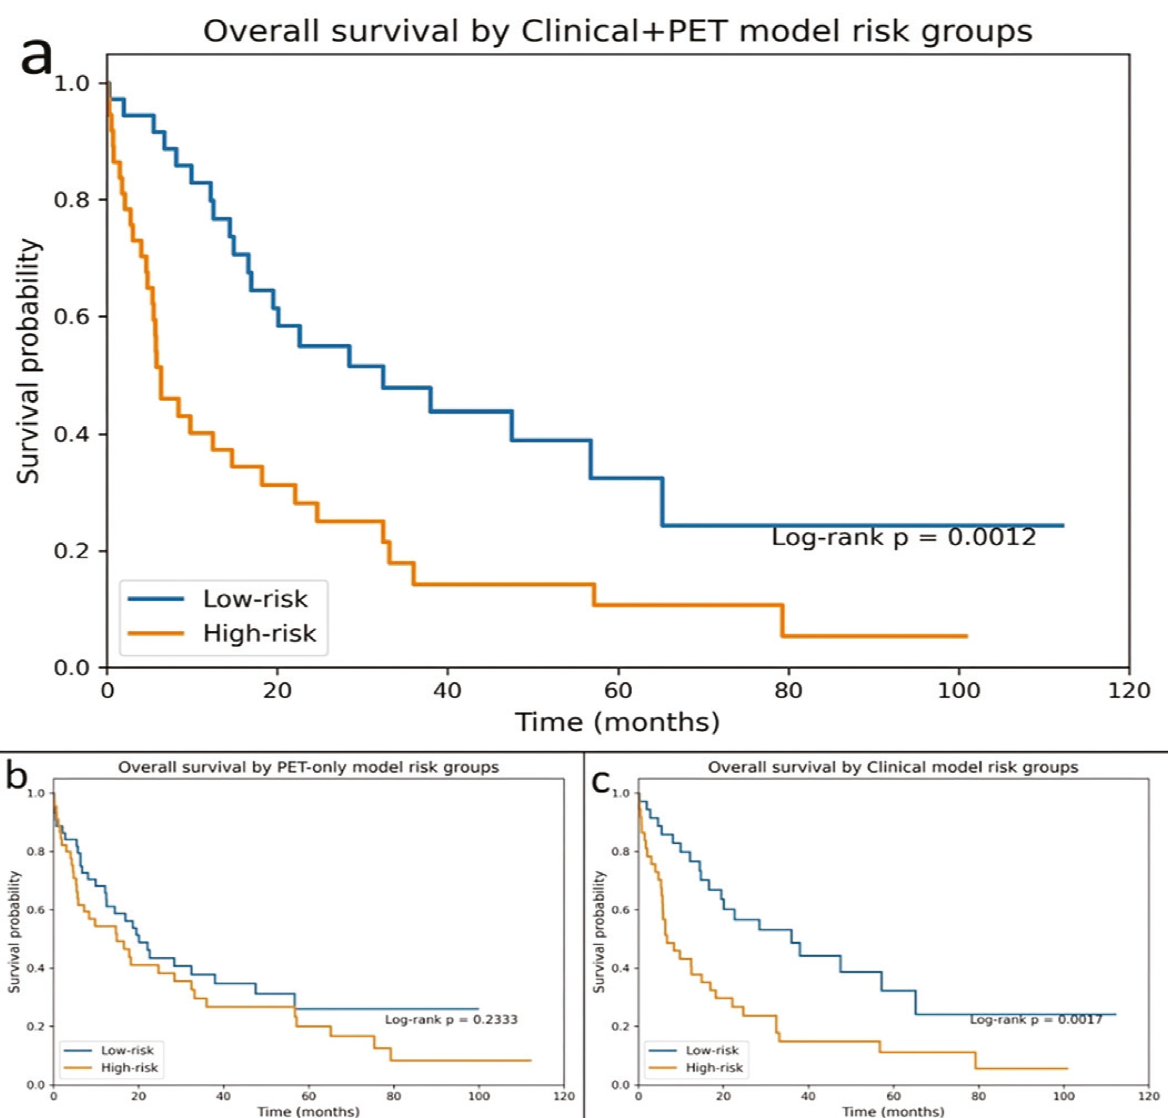
(a) Clinical+PET combined model: patients were divided into low- and high-risk groups based on the median Cox linear predictor derived from clinical variables (age, sex, histologic differentiation, lymph node metastasis, and distant metastasis) together with PET-derived quantitative metrics (SULmax, SULpeak, SULmean, MTV_40, TLG_40, BLR_mean, SLR_mean, and tumor size).
(b) PET-only model: risk groups defined according to the median PET-based Cox linear predictor.
(c) Clinical model: stratification based on the Cox linear predictor derived from clinical factors alone.
PET: Positron emission tomography.
Model Calibration at Multiple Time Horizons
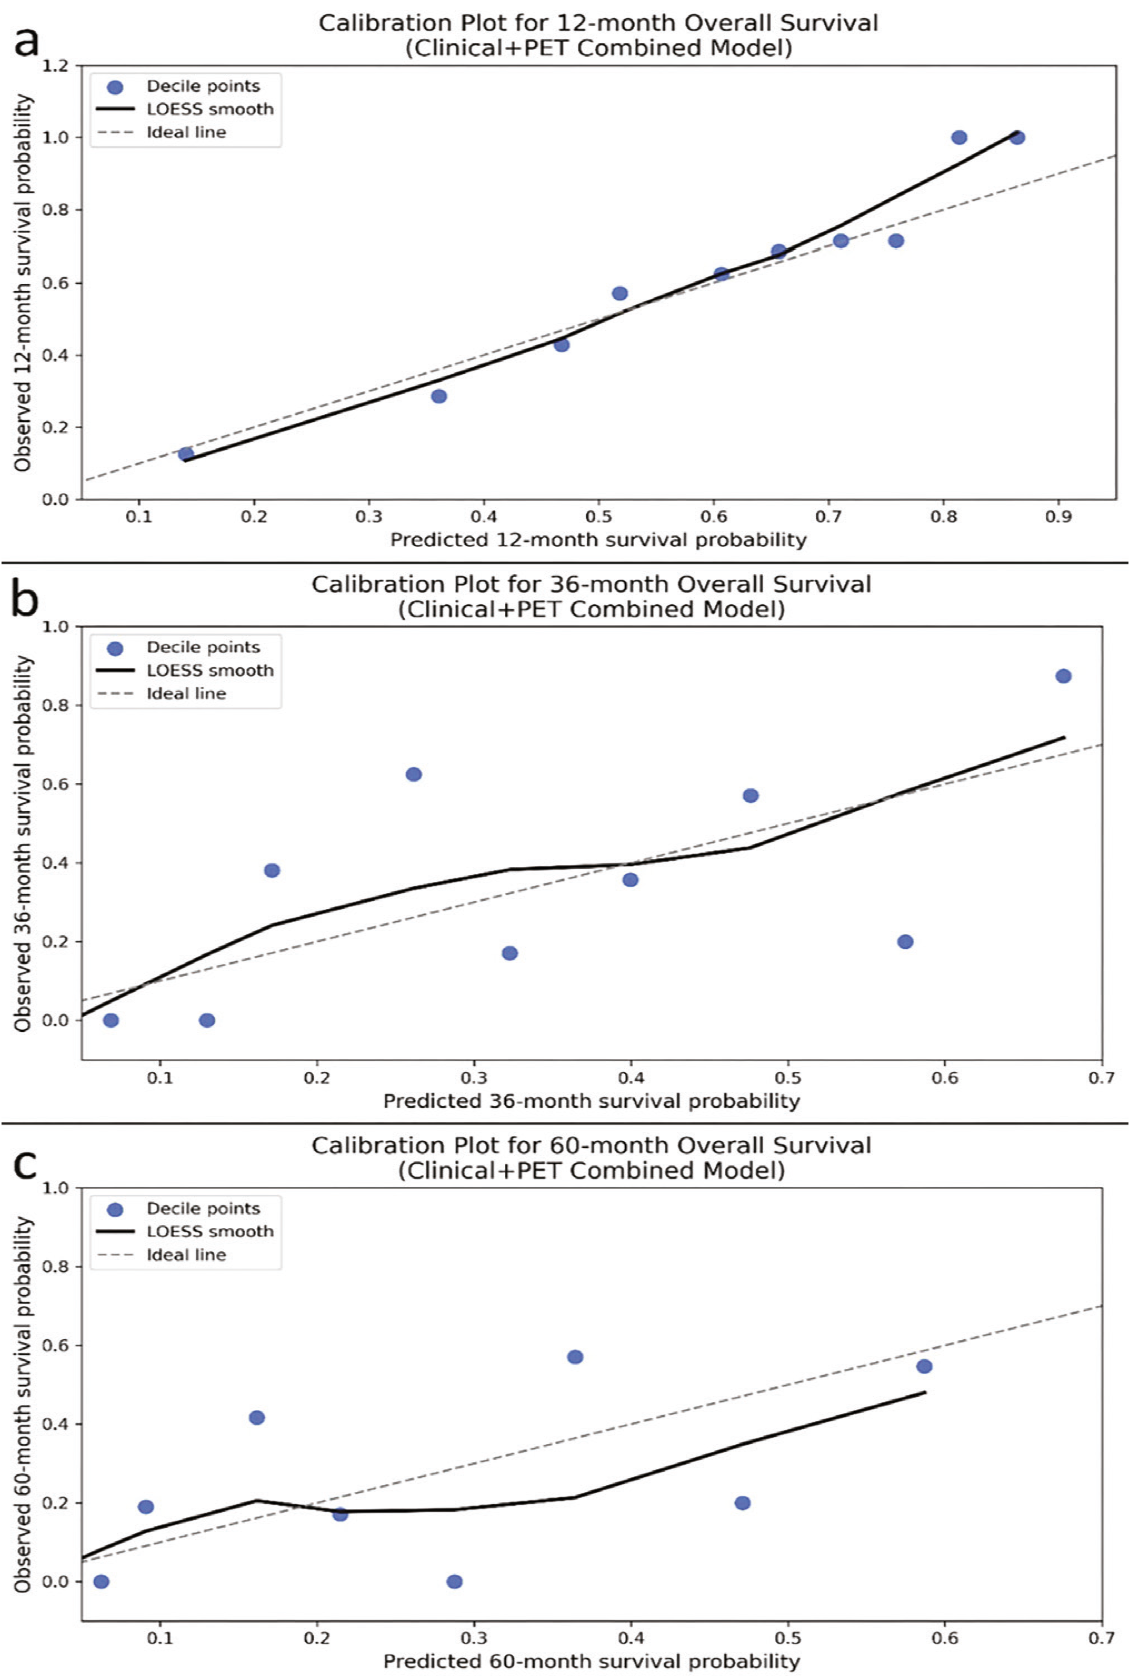
For model calibration at 12, 36, and 60 months, predicted survival probabilities from the Clinical+PET combined Cox model were obtained by evaluating the baseline survival function at each time point and applying the individual linear predictors. Predicted probabilities were grouped into 10 deciles, and the corresponding observed survival within each decile was estimated using Kaplan–Meier curves at the same horizon. Calibration was visualized using scatter plots of observed versus predicted survival, overlaid with a LOESS-smoothed curve and the ideal 45° reference line ().
PET: Positron emission tomography.
Decision-Curve Analysis
To evaluate the potential clinical utility of the prognostic models, we performed decision curve analysis (DCA) at 12 and 24 months. Model-based risks of death by time t were obtained from the Cox models, and patients censored before t were excluded from that horizon-specific analysis. Net benefit was calculated for threshold probabilities between 10% and 40% using the standard formula:
NB = [(TP / N) − (FP / N) × (pt / (1 − pt)]
Decision curves for the Clinical, PET-only, and Clinical+PET models were compared with the “treat all” and “treat none” reference strategies.
Presentation of multivariable effects
For each of the three multivariable Cox models (Clinical, PET-only, and Clinical+PET), HRs with 95% CIs were estimated and graphically summarized using forest plots.
Bootstrap-corrected calibration at 60 months
To further assess and adjust for potential optimism in model calibration, we performed a bootstrap-based out-of-bag (OOB) correction at the 60-month horizon for the Clinical+PET model. In each of 200 bootstrap replicates, a Cox model was refitted on the bootstrap sample, and 60-month survival probabilities were predicted only for OOB patients. For each patient, OOB predictions were then averaged across replicates to yield a bootstrap-corrected survival estimate. Apparent and OOB-corrected predictions were each grouped into 10 deciles, and observed survival within each decile was estimated from Kaplan–Meier curves. Calibration error was quantified using the mean absolute difference between predicted and observed probabilities (E_avg) and its 90th percentile (E90).
Distribution of predicted risk
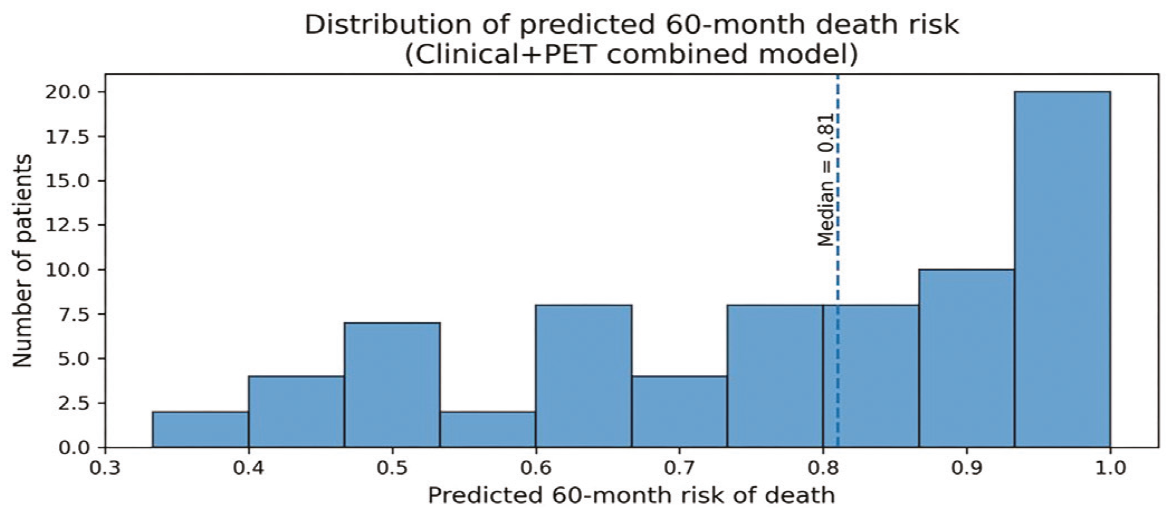
For descriptive purposes, 60-month death risks derived from the Clinical+PET Cox model [1−S(60|X)] were plotted as a histogram to illustrate the distribution of patient-level predictions. The cohort median predicted risk was displayed as a reference line.
Risk Distribution Analysis
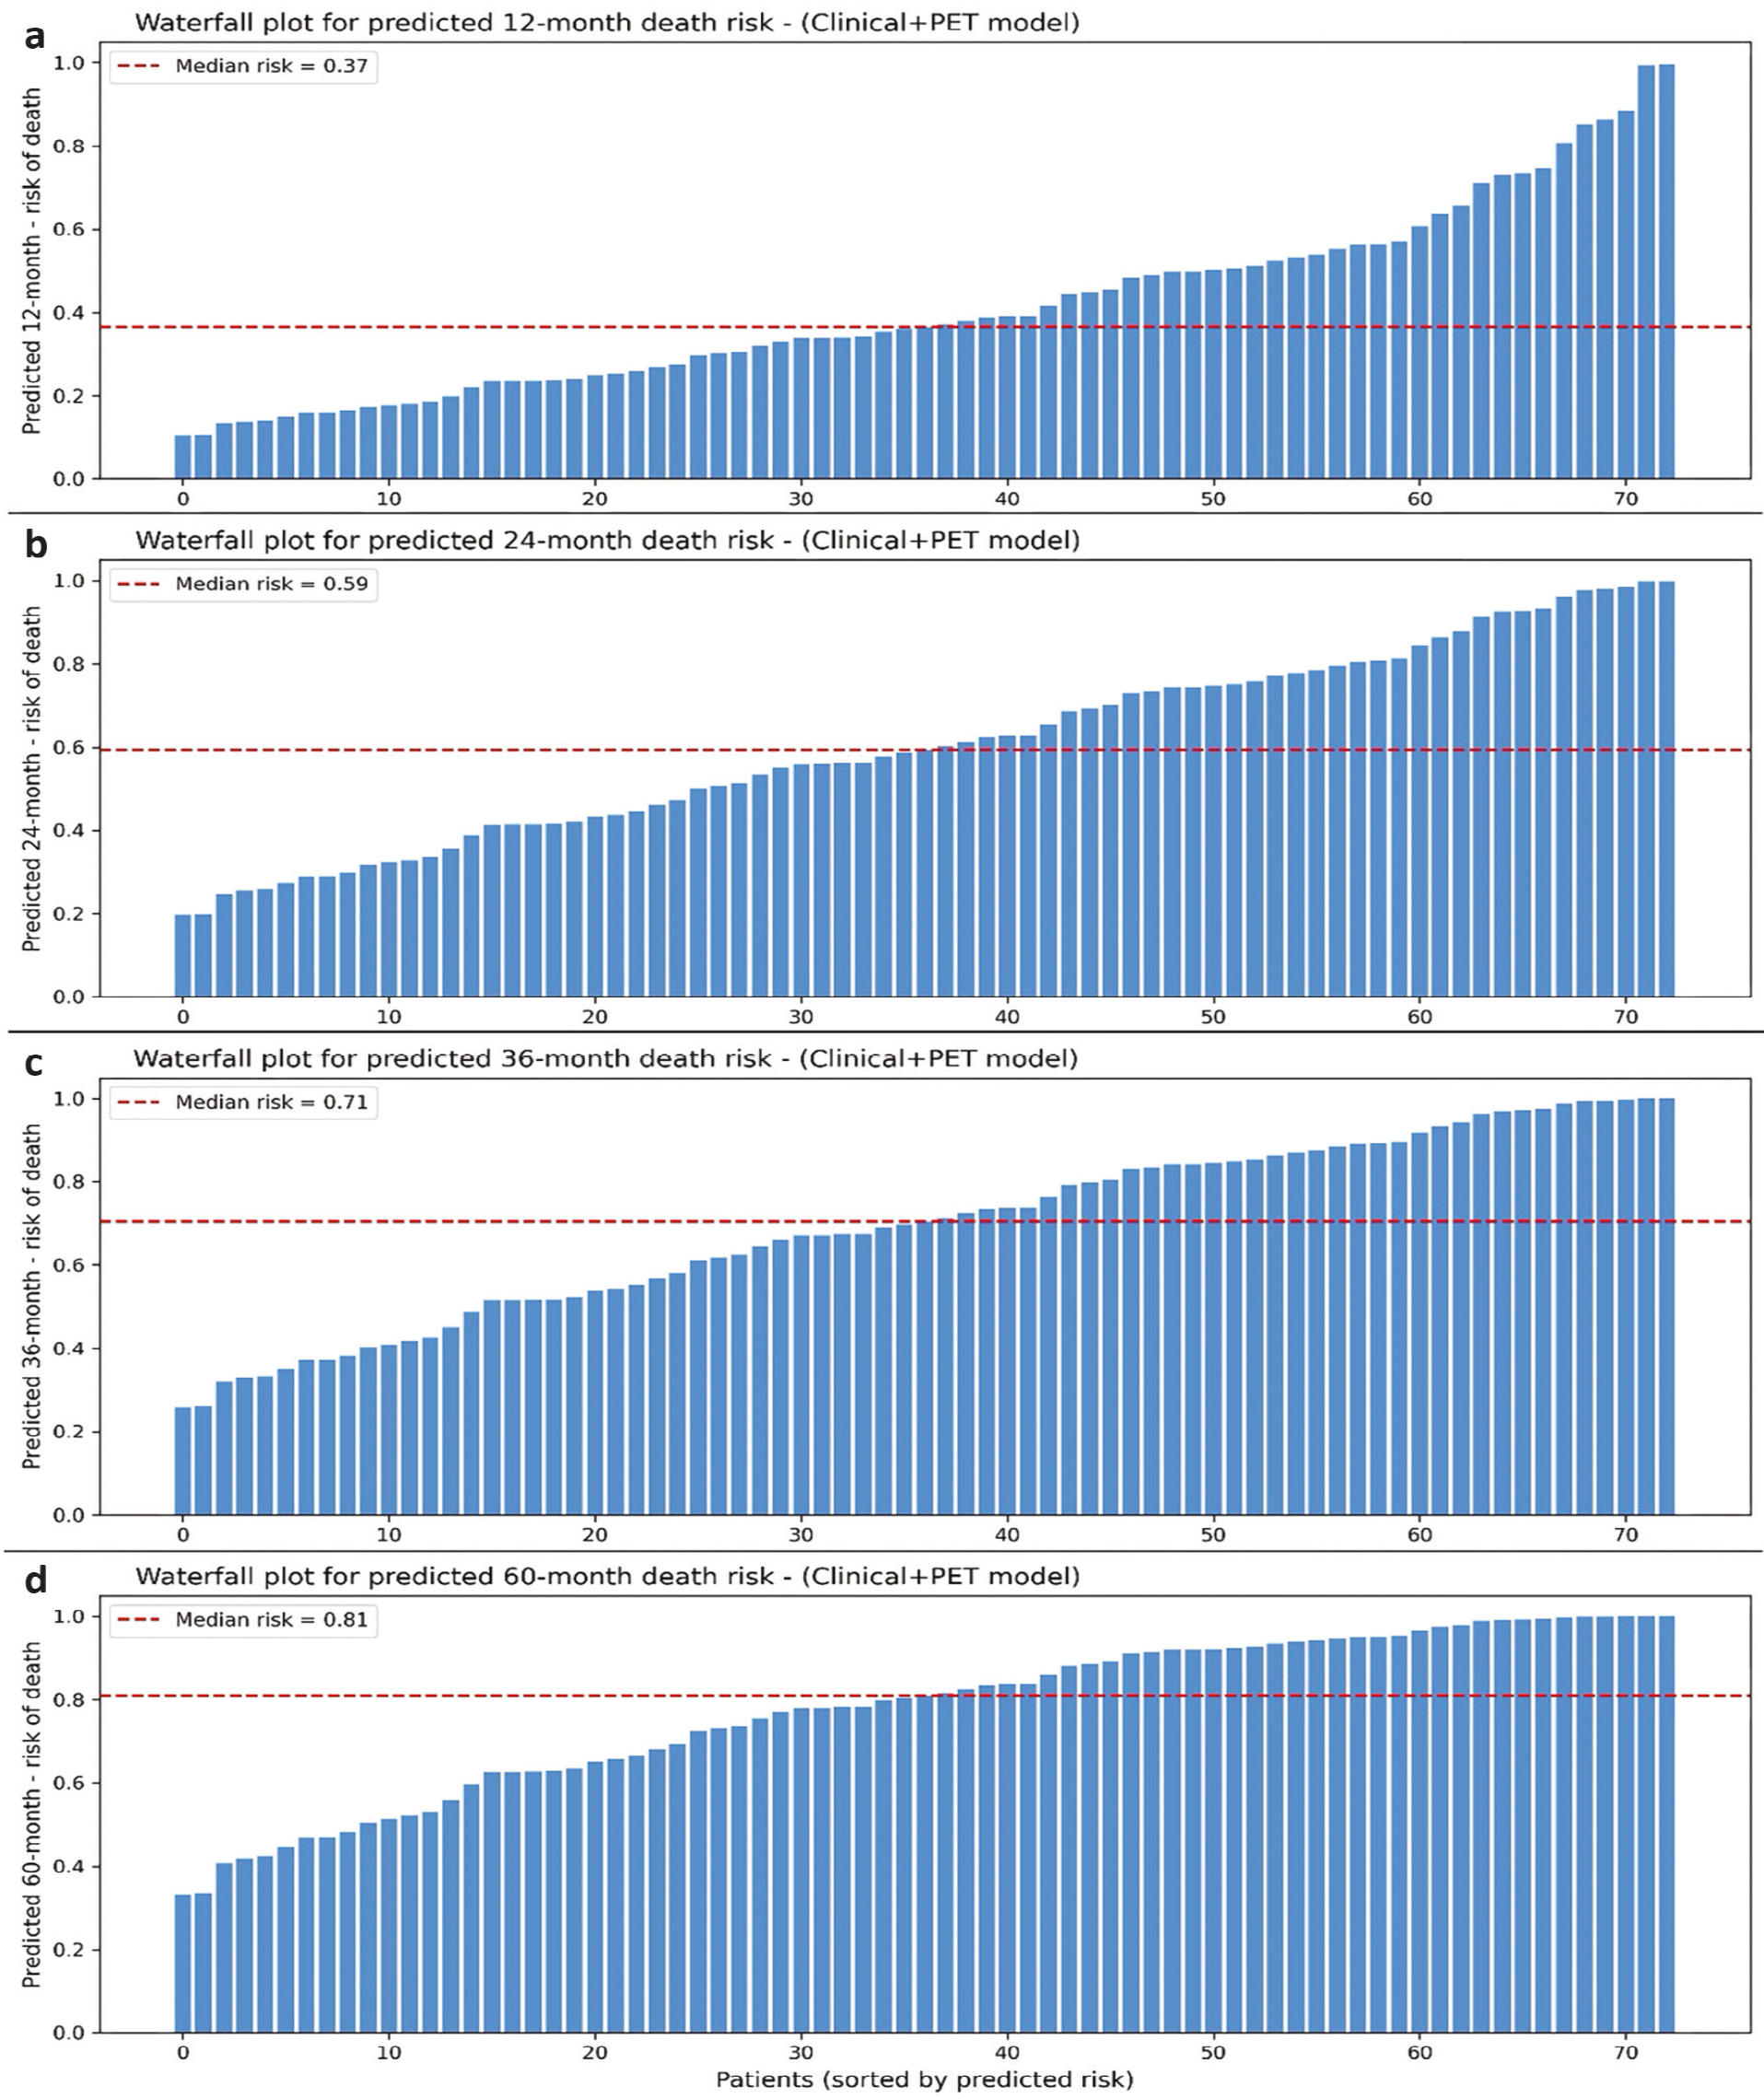
Risk distribution plots were generated to illustrate the spread of predicted probabilities of death among patients. For each time horizon (12, 24, 36, and 60 months), predicted survival probabilities were computed using the combined Clinical+PET Cox model by evaluating the baseline survival function at the specified time points. Individual predicted risks were defined as 1– S(t|X), sorted in ascending order, and displayed as waterfall plots, with the cohort median risk indicated by a horizontal reference line. For tertile-based Kaplan–Meier analyses, patients were stratified according to the distribution of the Clinical+PET model–estimated 60-month mortality risk using tertile cutoffs of approximately 0.70 and 0.91.
Performance Metrics
Time-dependent discrimination was assessed at 12, 24, 36, and 60 months using an inverse-probability-of-censoring-weighted estimator applied to each model’s linear predictor. Restricted mean survival time (RMST) was calculated for up to 60 months in low- and high-risk groups defined by the median risk score of the Clinical+PET model. For visual stratification of survival, the predicted 60-month risk was computed from the baseline survival function and used to generate tertile-based Kaplan–Meier curves.
Follow-Up Time Estimation (Reverse Kaplan–Meier)
Follow-up duration was estimated using the reverse Kaplan–Meier method, in which censoring and death indicators are exchanged to obtain the distribution of potential follow-up time. The median follow-up and its 95% CI were extracted from the survival function of the reversed-event process.
Exploratory ROC Analysis for HER2 Prediction
To assess the discriminatory ability of PET-derived quantitative metrics for HER2 status, we included patients with complete HER2 data. Continuous PET parameters (SUVmax, SUVpeak, SUVmean, MTV_40, TLG_40, SUL-derived metrics, BLR_mean, SLR_mean, and tumor size) were evaluated individually using Receiver Operating Characteristic (ROC) analysis. Area under the curve (AUC) values and 95% CIs were estimated using bootstrap resampling (n = 1000 iterations). Given the limited number of HER2-positive cases (n = 12), this analysis was considered exploratory.
Study Design and Reporting
This observational study was conducted in accordance with the STROBE reporting principles. The design, data collection procedures, variables, and analytical methods were structured to meet these guidelines, and the completed STROBE checklist is included among the submission files.
RESULTS
Patient Characteristics
The study included 89 patients. The mean age was 64.2 ± 12.6 years, and 75.3% of the cohort were male. Lymph node metastasis was present in 67.4%, distant metastasis in 30.3%, and peritoneal carcinomatosis in 12.4% of patients. Detailed distributions of continuous and categorical variables are provided in . During follow-up, 64 deaths occurred, corresponding to an event rate of 71.9%.
Table 1. Baseline clinical, metabolic, and clinicopathologic characteristics of the cohort.
A. Continuous variables | - | - | - | - | - | - | - |
|---|---|---|---|---|---|---|---|
Variable | n | Mean | SD | Median | IQR | Min | Max |
Age (years) | 89 | 64.225 | 12.587 | 65.000 | 18.000 | 37.000 | 88.000 |
BMI (kg/m²) | 89 | 25.965 | 4.456 | 26.235 | 5.345 | 14.901 | 38.200 |
Weight (kg) | 89 | 72.348 | 13.531 | 72.000 | 18.000 | 40.000 | 104.000 |
Height (cm) | 89 | 166.899 | 8.666 | 167.000 | 10.000 | 143.000 | 185.000 |
Tumor size (mm) | 89 | 57.663 | 27.026 | 53.000 | 30.000 | 16.000 | 153.000 |
SUVmax | 89 | 9.518 | 6.424 | 7.660 | 5.390 | 2.700 | 35.640 |
SUVpeak | 89 | 7.759 | 5.545 | 5.980 | 4.820 | 2.140 | 30.970 |
SUVmean | 89 | 5.406 | 3.790 | 4.240 | 3.450 | 1.490 | 21.490 |
MTV_40 | 89 | 45.673 | 40.074 | 34.690 | 38.970 | 2.940 | 177.980 |
TLG_40 | 89 | 306.412 | 505.852 | 143.140 | 201.270 | 7.370 | 2736.410 |
SULmean (James) | 89 | 4.105 | 2.980 | 3.100 | 2.790 | 1.140 | 15.260 |
SULpeak (James) | 89 | 5.830 | 4.325 | 4.580 | 4.060 | 1.630 | 22.300 |
SULmax (James) | 89 | 7.146 | 4.991 | 5.730 | 4.920 | 2.070 | 25.050 |
BLR_mean | 89 | 1.240 | 0.333 | 1.212 | 0.394 | 0.000 | 1.930 |
SLR_mean | 89 | 0.909 | 0.187 | 0.909 | 0.175 | 0.187 | 1.478 |
B. Categorical variables | - | - | - | - | - | - | - |
Variable | Category | N | Percent | - | - | - | - |
Gender | Man | 67 | 75.28 | - | - | - | - |
Gender | Woman | 22 | 24.72 | - | - | - | - |
Lesion site | Antrum | 31 | 34.83 | - | - | - | - |
Lesion site | Corpus | 16 | 17.98 | - | - | - | - |
Lesion site | Cardia and corpus | 15 | 16.85 | - | - | - | - |
Lesion site | Corpus and antrum | 11 | 12.36 | - | - | - | - |
Lesion site | Cardia | 9 | 10.11 | - | - | - | - |
Lesion site | Cardia–fundus–corpus | 3 | 3.37 | - | - | - | - |
Lesion site | Cardia, corpus, and antrum | 1 | 1.12 | - | - | - | - |
Lesion site | Cardia and fundus | 1 | 1.12 | - | - | - | - |
Lesion site | Corpus and fundus | 1 | 1.12 | - | - | - | - |
Lesion site | Cardia, fundus, corpus, antrum | 1 | 1.12 | - | - | - | - |
Peritonitis carcinomatosa | 0 | 78 | 87.64 | - | - | - | - |
Peritonitis carcinomatosa | 1 | 11 | 12.36 | - | - | - | - |
Lymph node metastasis | 1 | 60 | 67.42 | - | - | - | - |
Lymph node metastasis | 0 | 29 | 32.58 | - | - | - | - |
Bone metastasis | 0 | 81 | 91.01 | - | - | - | - |
Bone metastasis | 1 | 8 | 8.99 | - | - | - | - |
Liver metastasis | 0 | 76 | 85.39 | - | - | - | - |
Liver metastasis | 1 | 13 | 14.61 | - | - | - | - |
Lung metastasis | 0 | 87 | 97.75 | - | - | - | - |
Lung metastasis | 1 | 2 | 2.25 | - | - | - | - |
Adrenal metastasis | 0 | 88 | 98.88 | - | - | - | - |
Adrenal metastasis | 1 | 1 | 1.12 | - | - | - | - |
Pathological subtype | Tubular | 49 | 55.1 | - | - | - | - |
Pathological subtype | Poorly cohesive | 27 | 30.3 | - | - | - | - |
Pathological subtype | Mucinous | 6 | 6.70 | - | - | - | - |
Pathological subtype | Signet ring cell | 4 | 4.50 | - | - | - | - |
Pathological subtype | Medullary | 2 | 2.20 | - | - | - | - |
Pathological subtype | Hepatoid | 1 | 1.10 | - | - | - | - |
Differentiation | 1 (well) | 4 | 4.50 | - | - | - | - |
Differentiation | 2 (moderate) | 51 | 57.3 | - | - | - | - |
Differentiation | 3 (poor) | 34 | 38.2 | - | - | - | - |
HER2 | 0 | 58 | 65.20 | - | - | - | - |
HER2 | 1 | 12 | 13.50 | - | - | - | - |
HER2 | Missing | 19 | 21.30 | - | - | - | - |
Min: Minimum, Max: Maximum, SD: Standard deviation, IQR: Interquartile range, BMI: Body mass index.
Size refers to the longest diameter of the primary tumor, as measured on CT. SUV-based metrics were extracted from baseline 18F-FDG PET/CT scans acquired before treatment. MTV and TLG were calculated using a 40% SUVmax threshold. Continuous variables are reported as mean ± SD, median with IQR, and minimum–maximum values.
Univariate Analyses
In univariable Cox regression analyses, SULmean_James (HR 1.075, p = 0.048) was significantly associated with worse OS, while SULpeak_James (p = 0.053) and TLG_40 (p = 0.057) showed borderline significance. Among the background-normalized ratios, SLR_mean suggested the most pronounced increase in risk (HR 2.97; 95% CI, 0.67–13.12), whereas BLR_mean indicated a potential protective effect (HR 0.64); however, both estimates were statistically non-significant due to wide CIs (p = 0.150 and p = 0.304, respectively). Conventional SUV parameters and the remaining volumetric metric (MTV_40) demonstrated weaker and generally non-significant trends ().
Table 2. Univariable associations between baseline PET/CT metrics and overall survival.
Variable | HR | CI_lower | CI_upper | p-value | n_used |
|---|---|---|---|---|---|
SULmean_James | 1.075 | 1.001 | 1.155 | 0.048 | 89 |
SULpeak_James | 1.048 | 0.999 | 1.100 | 0.053 | 89 |
TLG_40 | 1.000 | 1.000 | 1.001 | 0.057 | 89 |
SULmax_James | 1.042 | 0.998 | 1.087 | 0.059 | 89 |
Size | 1.009 | 1.000 | 1.018 | 0.063 | 89 |
SUVmean | 1.052 | 0.995 | 1.112 | 0.074 | 89 |
MTV_40 | 1.006 | 0.999 | 1.012 | 0.075 | 89 |
SUVpeak | 1.034 | 0.997 | 1.074 | 0.076 | 89 |
SUVmax | 1.029 | 0.996 | 1.064 | 0.084 | 89 |
SLR_mean | 2.973 | 0.674 | 13.117 | 0.150 | 89 |
BLR_mean | 0.641 | 0.274 | 1.497 | 0.304 | 89 |
CI: Confidence interval, TLG: Total lesion glycolysis.
Univariable Cox proportional hazards models were used to assess the relationships between quantitative baseline PET/CT parameters and OS. HRs are presented with 95% CIs and Wald p-values. Each parameter was analyzed in a separate Cox model; n_used denotes the number of patients with available data for that variable (total analyzed cohort, n = 89). MTV_40 and TLG_40 were calculated using a 40% SUVmax threshold.
Multivariable Analyses
1. Clinical Model
In the clinical model, two variables were independently associated with OS:
Age (HR = 1.04; 95% CI, 1.01–1.06; p = 0.006)
Presence of distant metastasis (HR = 2.16; 95% CI, 1.14–4.09; p = 0.018)
The model’s discriminative performance was c-index = 0.669.
2. PET-Only Model
In the PET-only model, two background-normalized ratios stood out as independent predictors. Higher BLR_mean was associated with a lower risk of mortality (HR 0.26; p = 0.010), whereas SLR_mean showed the opposite pattern, with a markedly increased risk (HR 6.82; p = 0.032). By contrast, conventional SUV/SUL measures and the volumetric parameters (MTV_40 and TLG_40) did not reach independent significance.
3. Clinical + PET Combined Model
Incorporating PET-derived variables into the clinical model modestly improved prognostic performance. Within the combined model, MTV_40 (HR ≈ 1.02; p = 0.068) and BLR_mean (HR ≈ 0.32; p = 0.079) showed borderline associations with OS. In contrast, in the PET-only model, BLR_mean (p = 0.010) and SLR_mean (p = 0.032) were statistically significant predictors. The Clinical+PET combined model achieved the highest discrimination among the three predefined models (c-index = 0.728). Full results are presented in .
Table 3. Multivariable Cox proportional hazards models for overall survival.
Covariate | Model | HR | HR_lower_95 | HR_upper_95 | p | coef | se (coef) |
|---|---|---|---|---|---|---|---|
Age | Clinical | 1.035 | 1.010 | 1.061 | 0.006 | 0.034 | 0.013 |
Gender_bin | Clinical | 0.911 | 0.460 | 1.804 | 0.789 | -0.093 | 0.349 |
Differentiation | Clinical | 1.336 | 0.792 | 2.254 | 0.278 | 0.290 | 0.267 |
LN_met | Clinical | 1.429 | 0.738 | 2.764 | 0.289 | 0.357 | 0.337 |
Any_distant_met | Clinical | 2.162 | 1.143 | 4.089 | 0.018 | 0.771 | 0.325 |
SULmax_James | PET | 0.741 | 0.327 | 1.678 | 0.472 | -0.300 | 0.417 |
SULpeak_James | PET | 1.161 | 0.559 | 2.411 | 0.689 | 0.149 | 0.373 |
SULmean_James | PET | 1.431 | 0.620 | 3.303 | 0.402 | 0.358 | 0.427 |
TLG_40 | PET | 0.999 | 0.998 | 1.001 | 0.460 | -0.001 | 0.001 |
MTV_40 | PET | 1.007 | 0.993 | 1.021 | 0.314 | 0.007 | 0.007 |
BLR_mean | PET | 0.264 | 0.095 | 0.731 | 0.010 | -1.332 | 0.520 |
SLR_mean | PET | 6.823 | 1.179 | 39.493 | 0.032 | 1.920 | 0.896 |
Size | PET | 1.007 | 0.990 | 1.024 | 0.447 | 0.007 | 0.009 |
Age | Clinical+PET | 1.033 | 1.005 | 1.063 | 0.022 | 0.033 | 0.014 |
Gender_bin | Clinical+PET | 1.103 | 0.530 | 2.296 | 0.793 | 0.098 | 0.374 |
Differentiation | Clinical+PET | 1.250 | 0.699 | 2.235 | 0.452 | 0.223 | 0.297 |
LN_met | Clinical+PET | 1.044 | 0.427 | 2.555 | 0.925 | 0.043 | 0.457 |
Any_distant_met | Clinical+PET | 2.085 | 1.005 | 4.324 | 0.048 | 0.735 | 0.372 |
SULmax_James | Clinical+PET | 0.742 | 0.265 | 2.080 | 0.571 | -0.298 | 0.526 |
SULpeak_James | Clinical+PET | 1.262 | 0.517 | 3.079 | 0.609 | 0.233 | 0.455 |
SULmean_James | Clinical+PET | 1.313 | 0.520 | 3.321 | 0.564 | 0.273 | 0.473 |
TLG_40 | Clinical+PET | 0.999 | 0.997 | 1.001 | 0.319 | -0.001 | 0.001 |
MTV_40 | Clinical+PET | 1.019 | 0.999 | 1.040 | 0.068 | 0.019 | 0.010 |
BLR_mean | Clinical+PET | 0.318 | 0.089 | 1.140 | 0.079 | -1.144 | 0.651 |
SLR_mean | Clinical+PET | 3.987 | 0.523 | 30.389 | 0.182 | 1.383 | 1.036 |
Size | Clinical+PET | 0.994 | 0.972 | 1.015 | 0.559 | -0.006 | 0.011 |
Differentiation was coded as an ordinal variable (1 = well-differentiated, 2 = moderately differentiated, 3 = poorly differentiated).
BLR_mean = tumor-to-liver- bone marrow SUVmean ratio; SLR_mean = tumor-to-spleen SUVmean ratio.
PET/CT: Positron emission tomography/computed tomography.
Multivariable Cox models were fitted using three predefined predictor sets: a clinical model (age, gender, tumour differentiation, lymph-node metastasis, any distant metastasis), a PET-only model (SULmax, SULpeak, SULmean, MTV_40, TLG_40, BLR_mean, SLR_mean, tumour size), and a combined Clinical + PET model including all variables from both sets. For each covariate, HRs with 95% CIs and Wald p-values are reported.
Overall Interpretation
Among the three prespecified models, the combined Clinical+PET model provided the highest prognostic performance, whereas the PET-only and clinical models demonstrated more limited but complementary discriminatory performance. Kaplan–Meier curves for these risk models are presented in .
Survival curves were compared using the log-rank test. Time shown in months.
Calibration of the Clinical+PET model showed good overall agreement between predicted and observed survival across all three time horizons (12, 36, and 60 months).
At 12 months, predicted probabilities aligned closely with observed outcomes, with minimal systematic deviation ().
At 36 months, the model maintained broadly acceptable calibration, although some variability was noted in mid-range risk strata ().
At 60 months, calibration remained acceptable, but the model tended to modestly overestimate survival in higher predicted-risk groups, consistent with a mild upward drift of the LOESS curve relative to the ideal 45° line ().
Each point represents one decile of predicted survival probabilities, averaged across patients within that decile. Observed survival was estimated from Kaplan–Meier curves at the corresponding horizons (12, 36, or 60 months). The dashed diagonal line denotes perfect calibration, while the solid line shows a LOESS-smoothed estimate of the observed–predicted relationship. The model showed close agreement between predicted and observed outcomes at 12 months, moderate variability at 36 months, and mild overestimation of survival probabilities in higher predicted-probability ranges at 60 months.
DCA indicated that the Clinical+PET model performed best at 12 and 24 months, offering greater net benefit than either the clinical-only or the PET-only model within the accepted 0.10–0.40 clinical threshold range.
The combined model demonstrated a superior net-benefit profile at 12 months, particularly for threshold probabilities between approximately 0.15 and 0.35 ().
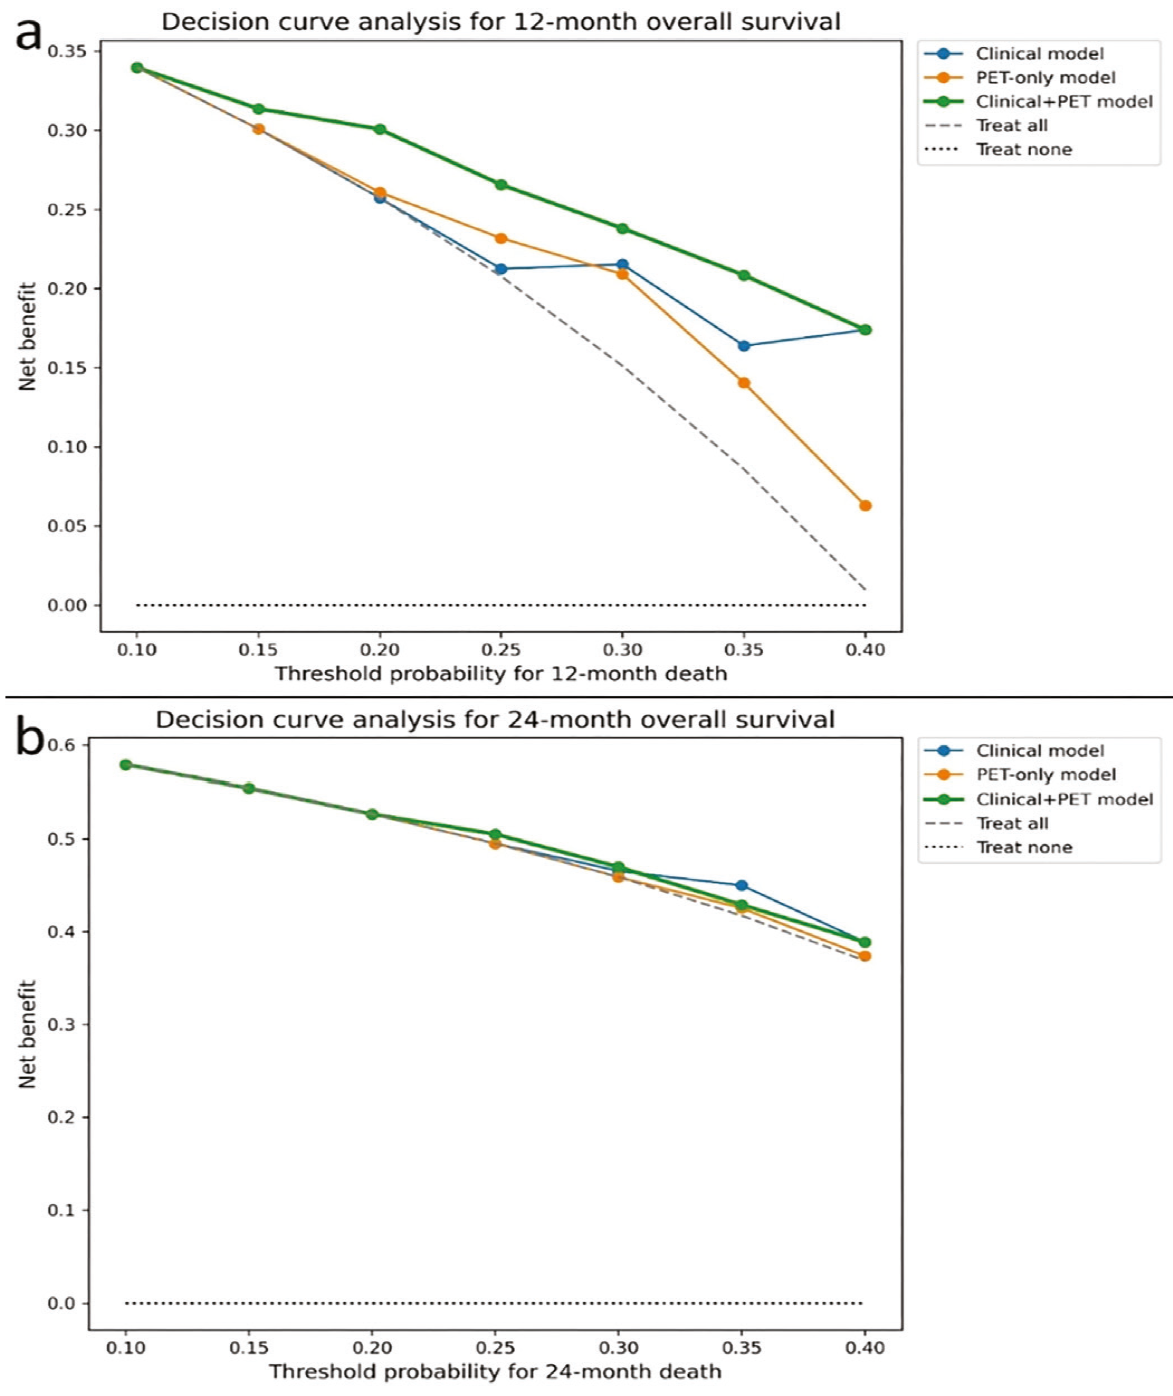
(a) Decision curve analysis at 12 months, comparing three prespecified Cox models: the clinical model (age, gender, differentiation, lymph node metastasis, distant metastasis).
The PET-only model included the predefined PET-derived variables, whereas the combined Clinical+PET model included both clinical and PET-derived variables.
The net benefit is plotted across threshold probabilities from 0.10 to 0.40, with reference lines for the 'treat-all' and 'treat-none' strategies.
The Clinical+PET model provides a consistently higher net benefit across most thresholds.
(b) Decision curve analysis at 24 months, showing a similar pattern, with the Clinical+PET model maintaining a small but consistent net-benefit advantage over the other two models.
PET: Positron emission tomography, MTV: Metabolic tumor volume, Total lesion glycolysis, SLR_mean: tumor-to-spleen SUVmean ratio.
At 24 months, all three models performed similarly, but the combined model again yielded a slightly higher net benefit across most thresholds ().
In multivariable Cox regression analysis (), age and distant metastasis remained independent clinical predictors of OS. Among PET-derived parameters, higher BLR_mean was associated with improved survival, whereas higher SLR_mean indicated increased mortality risk. In the combined Clinical+PET model, clinical factors retained their prognostic significance, whereas PET metrics did not substantially alter effect directions but improved overall model discrimination (c-index ≈0.73).
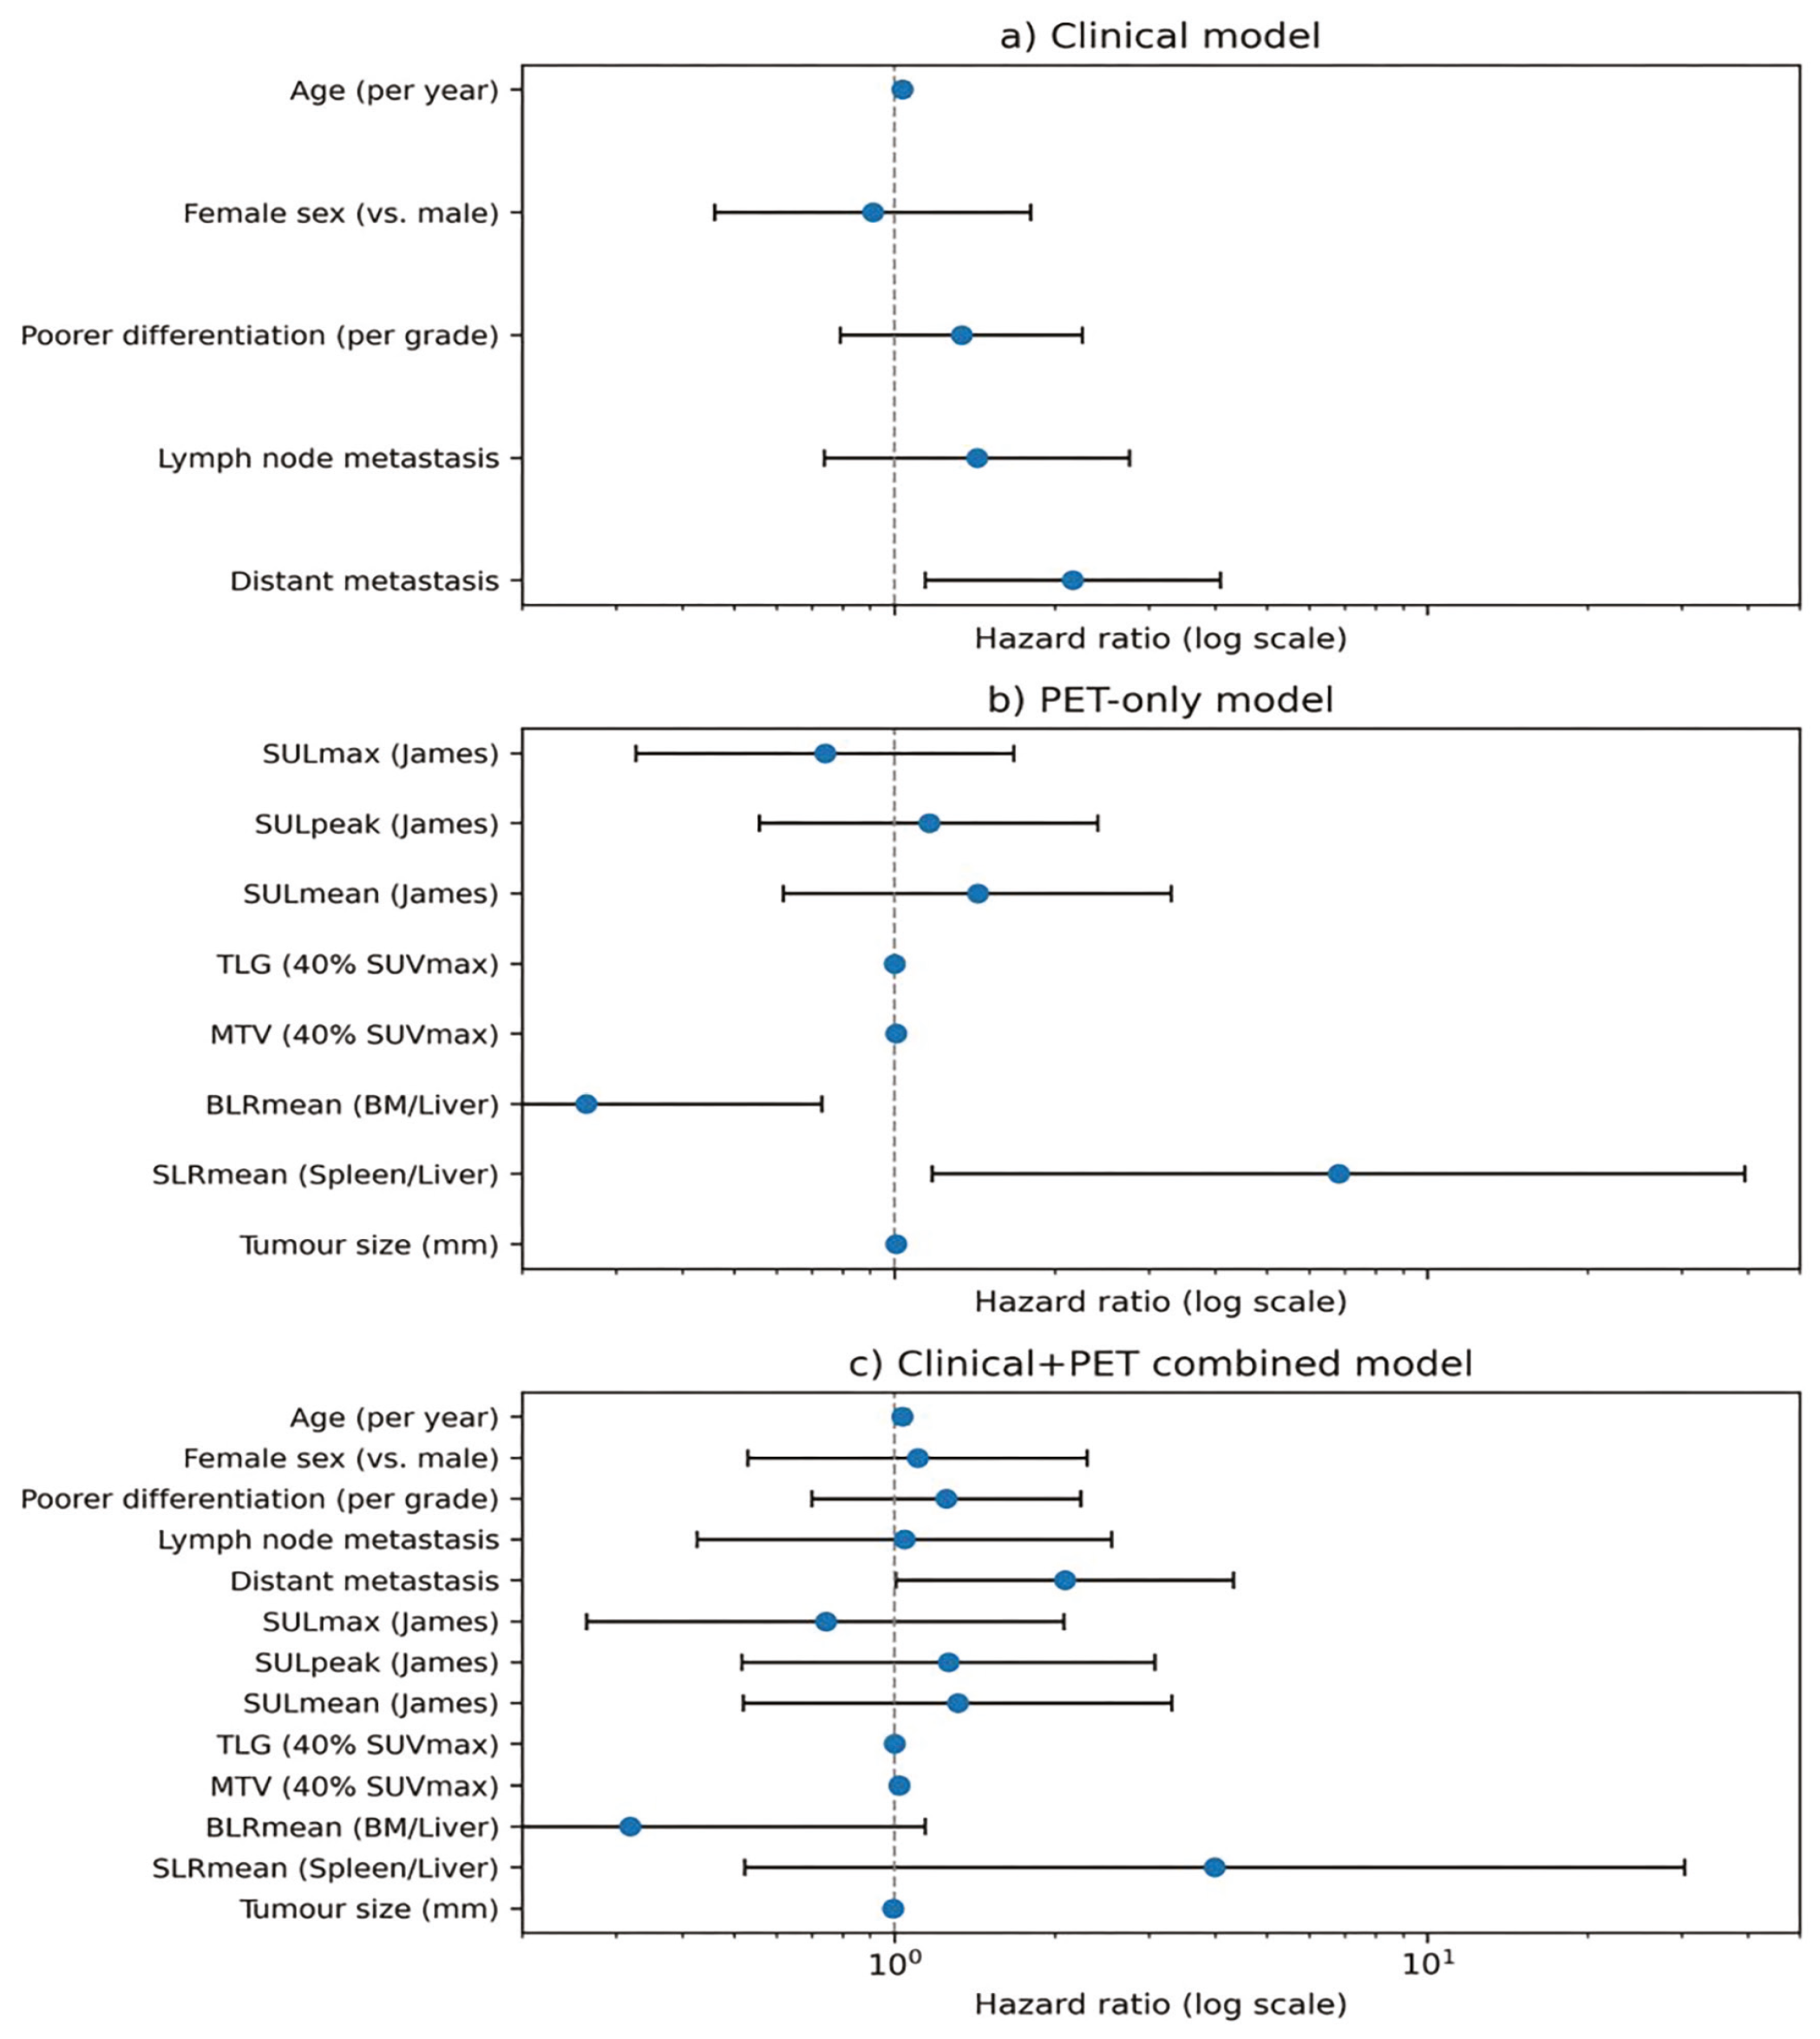
The forest plots show HRs and 95% CIs for (a) the clinical model, (b) the PET-only model, and (c) the combined Clinical+PET model. HRs are displayed on a logarithmic scale. Blue circles denote point estimates, and horizontal lines represent 95% CIs. The dashed vertical line indicates HR = 1. Clinical variables included age, sex, differentiation grade, lymph-node metastasis, and distant metastasis; PET variables included SULmax, SULpeak, SULmean, MTV_40, TLG_40, BLR_mean, SLR_mean, and tumor size.
PET: Positron emission tomography, MTV: Metabolic tumor volume, TLG: Total lesion glycolysis, SLR_mean: tumor-to-spleen SUVmean ratio, BLR_mean: tumor-to-bone marrow SUVmean ratio.
At 60 months, apparent calibration of the Clinical+PET model showed a mean absolute calibration error (E_avg) of 0.129 and a 90th-percentile error (E90) of 0.279. Bootstrap OOB–corrected estimates were very similar (E_avg = 0.136, E90 = 0.294), indicating only modest optimism and broadly preserved calibration after correction ().
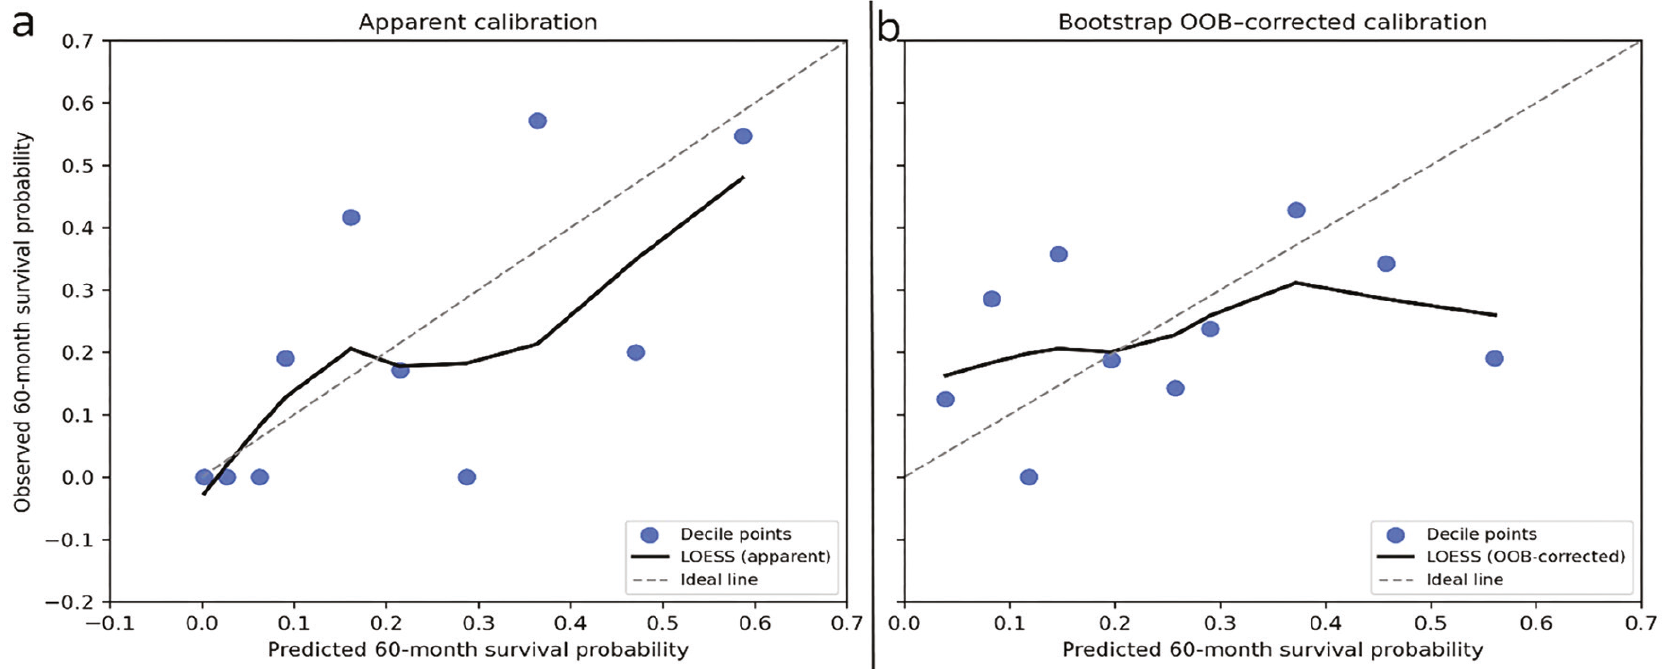
(a) The Clinical+PET Cox model was calibrated to predict the OS at 60 months. Predicted survival probabilities were grouped into 10 deciles, and observed survival within each decile was estimated from Kaplan–Meier curves at 60 months. Scatter points represent decile-specific predicted versus observed survival; the dashed diagonal line indicates perfect calibration, and the solid line shows a LOESS-smoothed calibration curve.
(b) Bootstrap out-of-bag (OOB)–corrected calibration at 60 months based on 200 bootstrap resamples. For each patient, OOB predictions were averaged across replicates to obtain a corrected survival estimate, which was then summarized in deciles and plotted analogously. Mean absolute calibration error (E_avg) was 0.129 for the apparent curve and 0.136 after OOB correction, with corresponding E90 values of 0.279 and 0.294.
The distribution of predicted 60-month mortality risk from the Clinical+PET model was right-skewed, indicating that most patients clustered within the lower predicted risk range. Predicted risks had a median of 0.81 (range, 0.33–1.00). This pattern aligns with the overall high-risk profile of the cohort ().
PET: Positron emission tomography.
Each bar represents the number of patients within a given probability interval. The dashed vertical line indicates the cohort median predicted risk (0.81). The distribution displays a right-shifted pattern, consistent with the high-risk profile of the cohort.
The risk plots showed that predicted mortality varied widely across patients. At 12, 24, 36, and 60 months, the predicted risk did not follow a symmetric distribution; instead, most patients had moderate risk values, with only a small fraction in the high-risk tail. Median predicted risk increased as the horizon extended, in line with the accumulation of events over time. The skew was most marked at 60 months, reflecting the greater long-term mortality burden in this cohort ().
PET: Positron emission tomography.
In the time-dependent AUC analysis, the Clinical+PET model maintained AUC values between 0.85 and 0.89 at all evaluated time points, and these values were higher than those of the Clinical-only and PET-only models. Taken together, a multidimensional comparison of model performance across discrimination, calibration, and clinical utility metrics is presented in . In the RMST analysis, low- and high-risk groups differed clearly, with mean restricted survival times of 33.9 months and 17.7 months, respectively. Kaplan–Meier curves based on tertiles of the predicted 60-month risk showed a stepwise separation, consistent with a strong prognostic signal of the model.
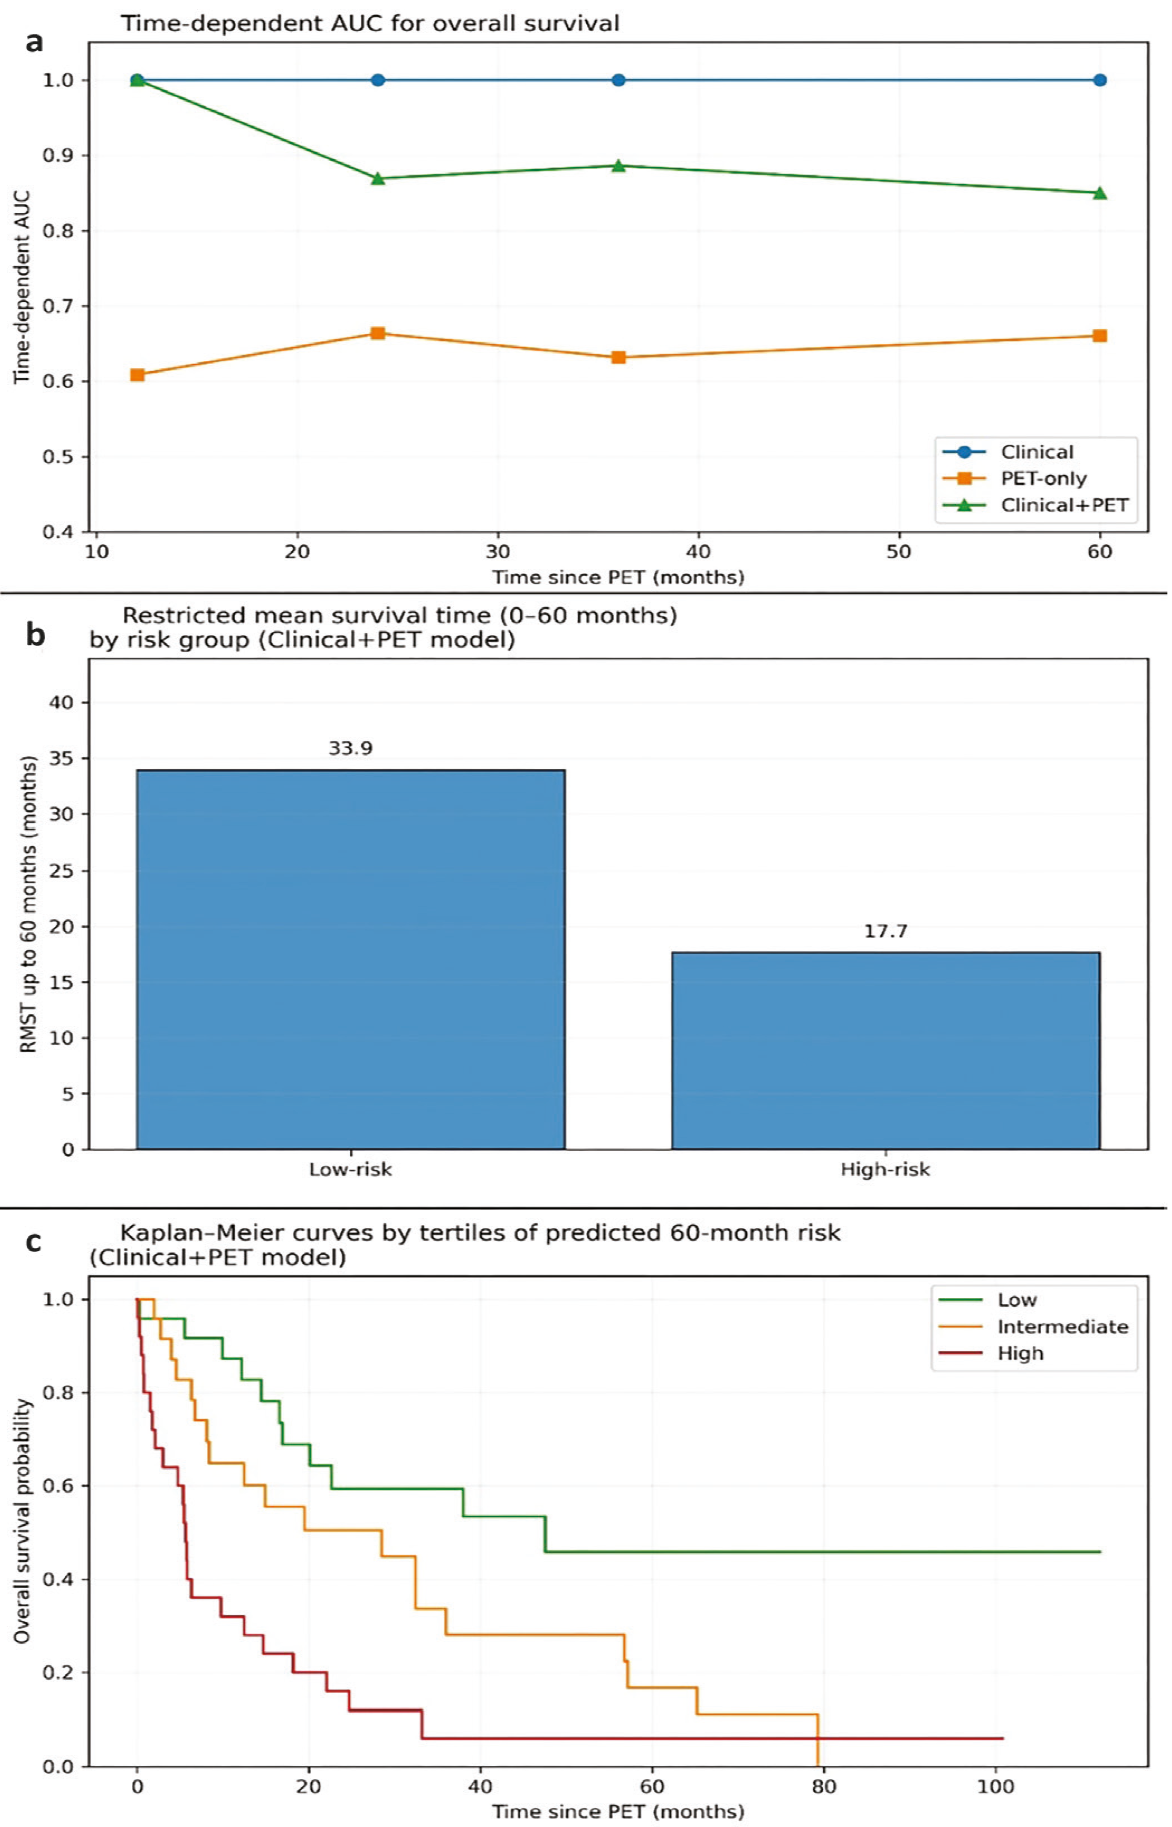
(a) Time-dependent AUC values at 12, 24, 36, and 60 months for the Clinical, PET-only, and Clinical+PET Cox models, computed using an IPCW-based estimator. The Clinical+PET model demonstrated the highest and most stable discrimination across all horizons.
(b) Restricted mean survival time (RMST) up to 60 months comparing low- and high-risk groups derived from the Clinical+PET model’s linear predictor. Low-risk patients had substantially longer event-free survival than high-risk patients.
(c) Kaplan–Meier survival curves stratified by tertiles of predicted 60-month mortality risk (Clinical+PET model). Clear monotonic separation was observed across the low-, intermediate-, and high-risk strata, consistent with strong overall prognostic discrimination.
PET: Positron emission tomography.
Median follow-up, calculated using the reverse Kaplan–Meier method, was 60.0 months (95% CI, 42.1–79.7 months) ().
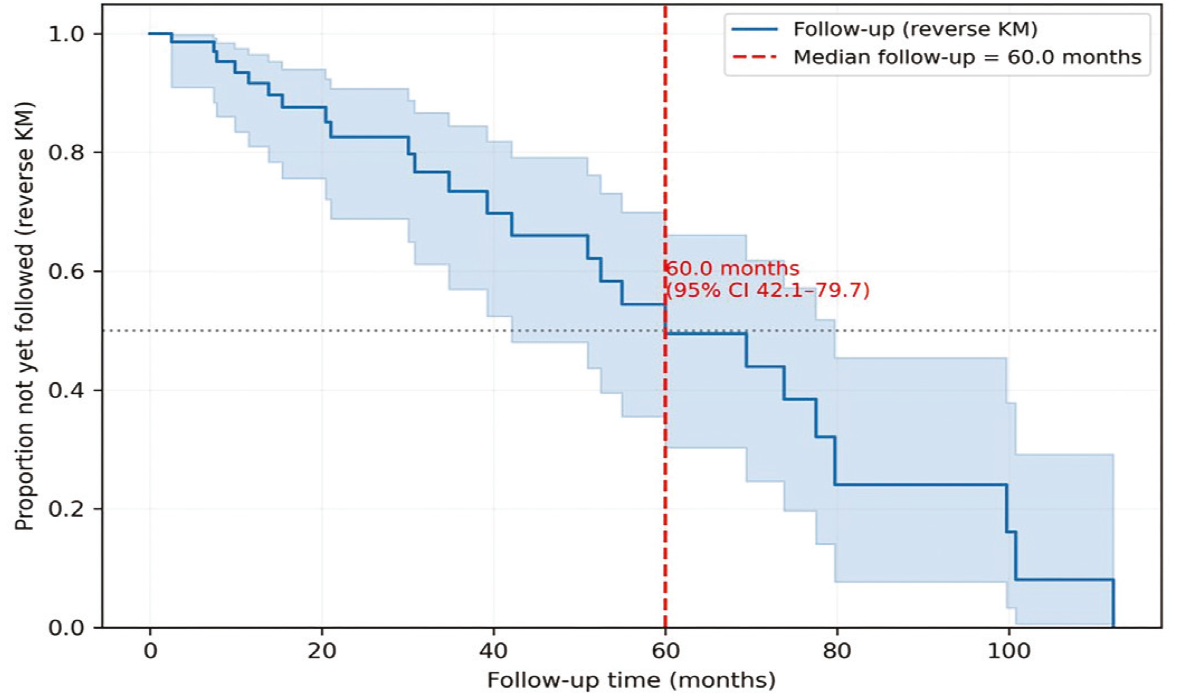
The reverse Kaplan–Meier method was used to estimate the distribution of potential follow-up time, treating deaths as censored observations and censoring events as failures. The vertical dashed line denotes the median follow-up of 60.0 months (95% CI, 42.1–79.7 months). Shaded areas represent the 95% confidence bands.
HER2 Status Prediction (Exploratory Analysis)
A subset of 70 patients with available HER2 data (HER2–: n=58; HER2+: n=12) was used to explore whether PET-derived metabolic and volumetric parameters could discriminate HER2 status. Overall discrimination was limited, with AUC values ranging from 0.536 to 0.609 across SUV/SUL- and volume-based metrics. The highest (yet still modest) performance was observed for SUVmean (AUC 0.609; 95% CI 0.406–0.796) and SULmean_James (AUC 0.606; 95% CI 0.404–0.787). BLR_mean and SLR_mean showed no discriminatory ability (AUC < 0.36). These results should be interpreted as exploratory due to the small number of HER2-positive cases ().
Table 4. Performance of PET/CT quantitative parameters for predicting HER2 status (exploratory analysis).
Variable | AUC | CI_lower | CI_upper | n_used |
|---|---|---|---|---|
SUVmax | 0.596 | 0.391 | 0.792 | 70 |
SUVpeak | 0.593 | 0.385 | 0.799 | 70 |
SUVmean | 0.609 | 0.406 | 0.796 | 70 |
MTV_40 | 0.536 | 0.320 | 0.733 | 70 |
TLG_40 | 0.579 | 0.346 | 0.793 | 70 |
SULmax_James | 0.601 | 0.400 | 0.785 | 70 |
SULpeak_James | 0.600 | 0.399 | 0.790 | 70 |
SULmean_James | 0.606 | 0.404 | 0.787 | 70 |
BLR_mean | 0.356 | 0.151 | 0.570 | 70 |
SLR_mean | 0.345 | 0.167 | 0.539 | 70 |
Size | 0.560 | 0.351 | 0.769 | 70 |
CI: Confidence interval, AUC: Area under the curve.
We conducted receiver operating characteristic (ROC) analysis for HER2 positivity based on individual PET-derived metrics (n=70; HER2–=58, HER2+=12). Values represent AUCs with 95% CIs. Given the small number of HER2-positive patients, results should be interpreted cautiously.
DISCUSSION
In this study, we evaluated whether a broad panel of 18F-FDG PET/CT metabolic and volumetric parameters improves the prediction of OS beyond established clinical variables in patients with GC. The need for more refined prognostication is well recognized. Gastric cancer (GC) remains a substantial global health concern (), and the biological heterogeneity described in the 2019 WHO classification continues to hinder consistent risk stratification (). These differences in tumor behavior encourage the search for quantitative biomarkers that capture tumor aggressiveness and complement routine clinicopathological features ().
The potential value of 18F-FDG PET/CT in this setting is supported by evidence showing that PET can reveal occult metastases and influence management in a substantial subset of patients considered for radical treatment (, , ). In addition to staging, metabolic data provide prognostic information that may indicate the underlying biology of the tumor. A number of prior studies have found that SUV-based metrics, especially SUVmax, correlate with worse clinical outcomes (, ). Because these values depend on technical factors such as uptake timing and image reconstruction (7-9,16-18), they offer only a partial view of tumor metabolism and may vary across institutions.
Volumetric parameters such as MTV and TLG, which reflect the overall metabolic burden, have shown more consistent prognostic value (). Studies in stage III and locally advanced GC frequently report that higher MTV or TLG is associated with inferior survival or an increased likelihood of early recurrence (-). Our findings are consistent with this literature. MTV_40 and TLG_40 showed trends toward contributing to the model, although these effects did not consistently reach statistical significance. Their inclusion was associated with a modest improvement in discrimination, while calibration remained acceptable. These results are consistent with earlier observations that volumetric tumor burden remains prognostically relevant even in biologically distinct subsets, such as c-MET–positive tumors (). The link between metabolic burden and c-MET activation supports a biological rationale for the observed associations.
Heterogeneity in FDG uptake has also emerged as a feature associated with aggressive tumor biology. Early work demonstrated that intratumor metabolic heterogeneity predicts survival independent of conventional metabolic or volumetric indices (). Additional prognostic evidence has also been reported from interim and restaging PET studies in metastatic or recurrent gastric cancer (, ). More recent analyses confirmed that heterogeneity-based metrics provide important prognostic information, likely reflecting variations in cell density, hypoxia, or necrosis (). In our cohort, although voxel-level heterogeneity metrics were not computed, BLR_mean emerged as a statistically significant PET-derived predictor and may act as a practical surrogate for metabolic variability, albeit within the limitations of our sample size.
Histological diversity remains an important determinant of FDG avidity. Diffuse-type and mucinous GCs typically show lower FDG uptake than intestinal-type tumors, which can complicate prognostic interpretation (). Such histological differences need to be considered when PET-derived biomarkers are incorporated into survival models. In our cohort, PET-based parameters showed directionally consistent associations with outcome after adjustment for clinicopathological variables, although these associations were attenuated. This suggests that metabolic tumor burden may capture risk across histological subtypes.
The link between FDG uptake and HER2 status has also attracted attention. Several reports have described higher SUV values in HER2-positive GCs (, ) or have proposed distinct metabolic patterns according to HER2 expression (-), although these studies are heterogeneous and generally involve modest sample sizes. In the present analysis, PET-derived metabolic parameters showed prognostic trends that were not fully explained by HER2 status. However, the number of HER2-positive cases was limited, and these findings should be interpreted with caution.
More recently, developments in image analysis have expanded the range of PET-based prognostic tools. Radiomics approaches, in particular, have been used to explore associations with survival, lymphovascular invasion, and treatment response (-). Machine learning approaches, including deep learning models, have demonstrated encouraging performance in estimating survival or immunotherapy response (). Although these methods were outside the scope of our study, our findings may serve as a foundation for future multimodal prognostic models that incorporate handcrafted and derived PET features.
PET has also been used extensively to assess response during neoadjuvant therapy. Several reports have shown that early metabolic changes after the first cycles of chemotherapy are associated with histopathological tumor regression and longer-term outcomes (-), although some subgroups appear to benefit less from this approach (). Our study centered on pretreatment scans rather than treatment response, but early metabolic change remains a promising area for future research, particularly when evaluated alongside volumetric PET measures.
Radiomics-based and advanced quantitative analyses have also been used to predict metastatic risk. Baseline PET radiomics features were associated with subsequent distant metastases in gastro-esophageal cancers in a recent prospective investigation (). Our results suggest that PET-derived signatures may help to identify patients at higher risk who could be candidates for more intensive systemic therapy or closer surveillance.
Taken together with previous work, this supports a complementary, rather than standalone, role for PET-based metrics. In our dataset, adding PET parameters to clinical factors improved model discrimination and increased net benefit across relevant decision thresholds while maintaining acceptable calibration. These observations argue for incorporating PET information into prognostic models, especially when treatment decisions depend on estimated risk.
Study Limitations
It was a retrospective, single-center study, which may limit the generalizability of the findings. Diffuse-type tumors with intrinsically low FDG uptake may have attenuated the apparent prognostic value of metabolic parameters. We did not investigate texture-based radiomics features, which could provide complementary information but would require robust standardization before clinical use. Treatment heterogeneity, particularly with respect to HER2-targeted regimens, also restricted the depth of subgroup analyses, and HER2 status was unavailable in a subset of patients. However, all PET/CT studies were acquired and processed using uniform protocols and a standardized segmentation workflow, which likely reduced measurement variability and supported the internal consistency of the results.
CONCLUSION
Our results indicate that 18F-FDG PET/CT–derived metabolic and volumetric parameters offer complementary prognostic information beyond routine clinical factors in GC. The consistent associations observed for MTV_40, TLG_40, SULpeak, and BLR_mean support their use as practical imaging biomarkers that can strengthen survival models. Integrating these PET-derived measures with clinical variables may improve risk stratification and support more informed therapeutic decision-making in selected patients.
Footnotes
Ethics
Ethics Committee Approval: This study was approved by the Noninterventional Clinical Research Ethics Committee of Göztepe Prof. Dr. Süleyman Yalçın City Hospital (approval number: 2025/0053; date: 31.07.2025) and was conducted in accordance with the Declaration of Helsinki and Good Clinical Practice and Good Laboratory Practice standards.
Informed Consent: Waived due to the retrospective design of the study.
Authorship Contributions
Concept: M.T.T., A.A., E.İ., A.N.T.Y., Design: M.T.T., H.U., Data Collection or Processing: M.T.T., A.A., Analysis or Interpretation: M.T.T., E.İ., F.Y.T., Literature Search: M.T.T., F.Ö., Writing: M.T.T.
Conflict of Interest: No conflict of interest was declared by the authors.
Financial Disclosure: The authors declared that this study received no financial support.
References
GBD 2019 Cancer Risk Factors Collaborators. The global burden of cancer attributable to risk factors, 2010-19: a systematic analysis for the Global Burden of Disease Study 2019. Lancet. 2022; 400: 563-91.
Nagtegaal ID, Odze RD, Klimstra D, Paradis V, Rugge M, Schirmacher P, et al. The 2019 WHO classification of tumours of the digestive system. Histopathology. 2020; 76: 182-8.
Bosch KD, Chicklore S, Cook GJ, Davies AR, Kelly M, Gossage JA, et al. Staging FDG PET-CT changes management in patients with gastric adenocarcinoma who are eligible for radical treatment. Eur J Nucl Med Mol Imaging. 2020; 47: 759-67.
Findlay JM, Antonowicz S, Segaran A, El Kafsi J, Zhang A, Bradley KM, et al. Routinely staging gastric cancer with 18F-FDG PET-CT detects additional metastases and predicts early recurrence and death after surgery. Eur Radiol. 2019; 29: 2490-8.
Wu Z, Zhao J, Gao P, Song Y, Sun J, Chen X, et al. Prognostic value of pretreatment standardized uptake value of F-18-fluorodeoxyglucose PET in patients with gastric cancer: a meta-analysis. BMC Cancer. 2017; 17: 275.
Grabinska K, Pelak M, Wydmanski J, Tukiendorf A, d’Amico A. Prognostic value and clinical correlations of 18-fluorodeoxyglucose metabolism quantifiers in gastric cancer. World J Gastroenterol. 2015; 21: 5901-9.
Na SJ, o JH, Park JM, Lee HH, Lee SH, Song KY, et al. Prognostic value of metabolic parameters on preoperative 18F-fluorodeoxyglucose positron emission tomography/computed tomography in patients with stage III gastric cancer. Oncotarget. 2016; 7: 63968-80.
Song J, Li Z, Chen P, Yu J, Wang F, Yang Z, et al. A 18FDG PET/CT-based volume parameter is a predictor of overall survival in patients with local advanced gastric cancer. Chin J Cancer Res. 2019; 31: 632-40.
Sun G, Cheng C, Li X, Wang T, Yang J, Li D. Metabolic tumor burden on postsurgical PET/CT predicts survival of patients with gastric cancer. Cancer Imaging. 2019; 19: 18.
Liu G, Hu Y, Cheng X, Wang Y, Gu Y, Liu T, et al. Volumetric parameters on 18F-FDG PET/CT predict the survival of patients with gastric cancer associated with their expression status of c-MET. BMC Cancer. 2019; 19: 790.
Liu G, Yin H, Cheng X, Wang Y, Hu Y, Liu T, et al. Intra-tumor metabolic heterogeneity of gastric cancer on 18F-FDG PETCT indicates patient survival outcomes. Clin Exp Med. 2021; 21: 129-38.
Kim JS, Young Park S. (18)F-FDG PET/CT of advanced gastric carcinoma and association of HER2 expression with standardized uptake value. Asia Ocean J Nucl Med Biol. 2014; 2: 12-8.
Celli R, Colunga M, Patel N, Djekidel M, Jain D. Metabolic Signature on 18F-FDG PET/CT, HER2 Status, and Survival in Gastric Adenocarcinomas. J Nucl Med Technol. 2016; 44: 234-8.
Abbas M, Habib M, Naveed M, Karthik K, Dhama K, Shi M, et al. The relevance of gastric cancer biomarkers in prognosis and pre- and post- chemotherapy in clinical practice. Biomed Pharmacother. 2017; 95: 1082-90.
Shimada H, Okazumi S, Koyama M, Murakami K. Japanese Gastric Cancer Association Task Force for Research Promotion: clinical utility of ¹⁸F-fluoro-2-deoxyglucose positron emission tomography in gastric cancer. A systematic review of the literature. Gastric Cancer. 2011; 14: 13-21.
Vriens D, Visser EP, de Geus-Oei LF, Oyen WJ. Methodological considerations in quantification of oncological FDG PET studies. Eur J Nucl Med Mol Imaging. 2010; 37: 1408-25.
Wahl RL, Jacene H, Kasamon Y, Lodge MA. From RECIST to PERCIST: Evolving Considerations for PET response criteria in solid tumors. J Nucl Med. 2009; 50 Suppl 1: 122S-50S.
de Langen AJ, Vincent A, Velasquez LM, van Tinteren H, Boellaard R, Shankar LK, et al. Repeatability of 18F-FDG uptake measurements in tumors: a metaanalysis. J Nucl Med. 2012; 53: 701-8.
Kwon HR, Pahk K, Park S, Kwon HW, Kim S. Prognostic value of metabolic information in advanced gastric cancer using preoperative 18F-FDG PET/CT. Nucl Med Mol Imaging. 2019; 53: 386-95.
Lee SY, Seo HJ, Kim S, Eo JS, Oh SC. Prognostic significance of interim 18 F-fluorodeoxyglucose positron emission tomography-computed tomography volumetric parameters in metastatic or recurrent gastric cancer. Asia Pac J Clin Oncol. 2018; 14: e302-9.
Kim SH, Song BI, Kim HW, Won KS, Son YG, Ryu SW. Prognostic value of restaging F-18 fluorodeoxyglucose positron emission tomography/ computed tomography to predict 3-year post-recurrence survival in patients with recurrent gastric cancer after curative resection. Korean J Radiol. 2020; 21: 829-37.
Wang J, Yu X, Shi A, Xie L, Huang L, Su Y, et al. Predictive value of 18F-FDG PET/CT multi-metabolic parameters and tumor metabolic heterogeneity in the prognosis of gastric cancer. J Cancer Res Clin Oncol. 2023; 149: 14535-47.
Chon HJ, Kim C, Cho A, et al. The clinical implications of FDG-PET/CT differ according to histology in advanced gastric cancer. Gastric Cancer. 2019;22:113-22.
Park JS, Lee N, Beom SH, Kim HS, Lee CK, Rha SY, et al. The prognostic value of volume-based parameters using 18F-FDG PET/CT in gastric cancer according to HER2 status. Gastric Cancer. 2018; 21: 213-24.
Wang JL, Shi AQ, Fan CC, Wang YZ, Guo GR, Liu JY. [Correlations of 18F-FDG PET/CT metabolic parameters and metabolic heterogeneity with human epidermal growth factor receptor 2 expression in patients with gastric cancer]. Zhongguo Yi Xue Ke Xue Yuan Xue Bao. Acta Academiae Medicinae Sinicae. 2022 Aug; 44: 628-35.
Acar Tayyar MN, Tamam MÖ, Babacan GB, Şahin MC, Özçevik H, Şengiz Erhan S, et al. The relationship between HER2 status acquired from pathological data and metabolic parameters from pre-treatment [18F]FDG PET/CT in gastric adenocarcinomas. Rev Esp Med Nucl Imagen Mol (Engl Ed). 2025; 44: 500080.
Liu Q, Li J, Xin B, Sun Y, Wang X, Song S. Preoperative 18F-FDG PET/CT radiomics analysis for predicting HER2 expression and prognosis in gastric cancer. Quant Imaging Med Surg. 2023; 13: 1537-49.
Jiang Y, Yuan Q, Lv W, Xi S, Huang W, Sun Z, et al. Radiomic signature of 18F fluorodeoxyglucose PET/CT for prediction of gastric cancer survival and chemotherapeutic benefits. Theranostics. 2018; 8: 5915-28.
Amrane K, Thuillier P, Bourhis D, Le Meur C, Quere C, Leclere JC, et al. Prognostic value of pre-therapeutic FDG-PET radiomic analysis in gastro-esophageal junction cancer. Sci Rep. 2023; 13: 5789.
Adili D, Mohetaer A, Zhang W. Diagnostic accuracy of radiomics-based machine learning for neoadjuvant chemotherapy response and survival prediction in gastric cancer patients: a systematic review and meta-analysis. Eur J Radiol. 2024; 173: 111249.
Jiang Y, Zhang Z, Wang W, Huang W, Chen C, Xi S, et al. Biology-guided deep learning predicts prognosis and cancer immunotherapy response. Nat Commun. 2023; 14: 5135.
Yang L, Chu W, Li M, Xu P, Wang M, Peng M, et al. Radiomics in gastric cancer: First clinical investigation to predict lymph vascular invasion and survival outcome using 18F-FDG PET/CT Images. Front Oncol. 2022; 12: 836098.
Zhi H, Xiang Y, Chen C, Zhang W, Lin J, Gao Z, et al. Development and validation of a machine learning-based 18F-fluorodeoxyglucose PET/CT radiomics signature for predicting gastric cancer survival. Cancer Imaging. 2024; 24: 99.
Güç ZG, Turgut B, Avci A, Cengiz F, Eren Kalender M, Alacacioğlu A. Predicting pathological response and overall survival in locally advanced gastric cancer patients undergoing neoadjuvant chemotherapy: the role of PET/computed tomography. Nucl Med Commun. 2022; 43: 560-7.
Morgagni P, Bencivenga M, Colciago E, Tringali D, Giacopuzzi S, Framarini M, et al. Limited usefulness of 18F-FDG PET/CT in predicting tumor regression after preoperative chemotherapy for noncardia gastric cancer: The Italian Research Group for Gastric Cancer (GIRCG) Experience. Clin Nucl Med. 2020; 45: 177-81.
Schneider PM, Eshmuminov D, Rordorf T, Vetter D, Veit-Haibach P, Weber A, et al. 18FDG-PET-CT identifies histopathological non-responders after neoadjuvant chemotherapy in locally advanced gastric and cardia cancer: cohort study. BMC Cancer. 2018; 18: 548.
Park S, Ha S, Kwon HW, Kim WH, Kim TY, Oh DY, et al. Prospective Evaluation of Changes in Tumor Size and Tumor Metabolism in Patients with Advanced Gastric Cancer Undergoing Chemotherapy: Association and Clinical Implication. J Nucl Med. 2017; 58: 899-904.
Hinzpeter R, Mirshahvalad SA, Kulanthaivelu R, Kohan A, Ortega C, Metser U, et al. Gastro-esophageal cancer: can radiomic parameters from baseline 18F-FDG-PET/CT predict the development of distant metastatic disease? Diagnostics (Basel). 2024; 14: 1205.